LAFO site and Measurement data
The Land-Atmosphere Feedback Observatory (LAFO) test site is located south of Stuttgart, near to the Stuttgart airport, at approximately between 48° 42' North Latitude and 9°11' East Longitude.
The LAFO experimental site is relatively flat; its elevation varies between 398 and 412 meters.
The annual temperature varies between 0°C in winter and 18°C in summer months, and annual rainfall is 680 mm.
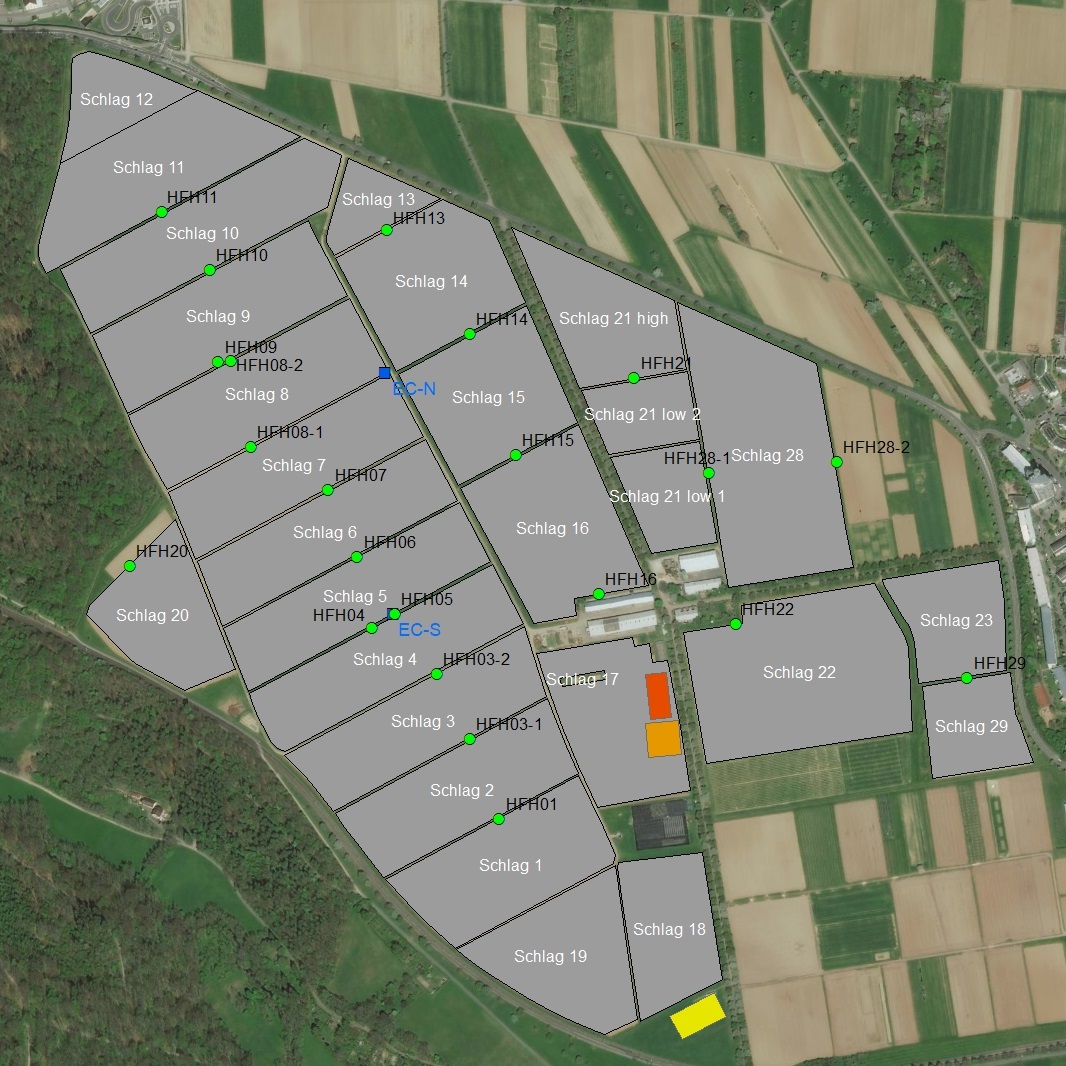
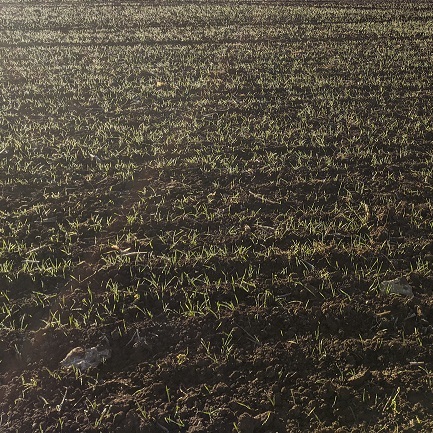
The study site is composed of 26 agricultural fields (“Schlage” in German) covering the surface area of 84 ha, is managed by the University of Hohenheim to use as a study site for different agricultural experiments.
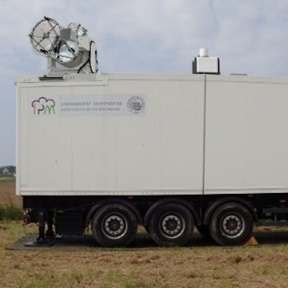
LAFO deploys several sensor systems and remote sensing equipment for obtaining data from below ground to the atmosphere up to 10km vertical extent.
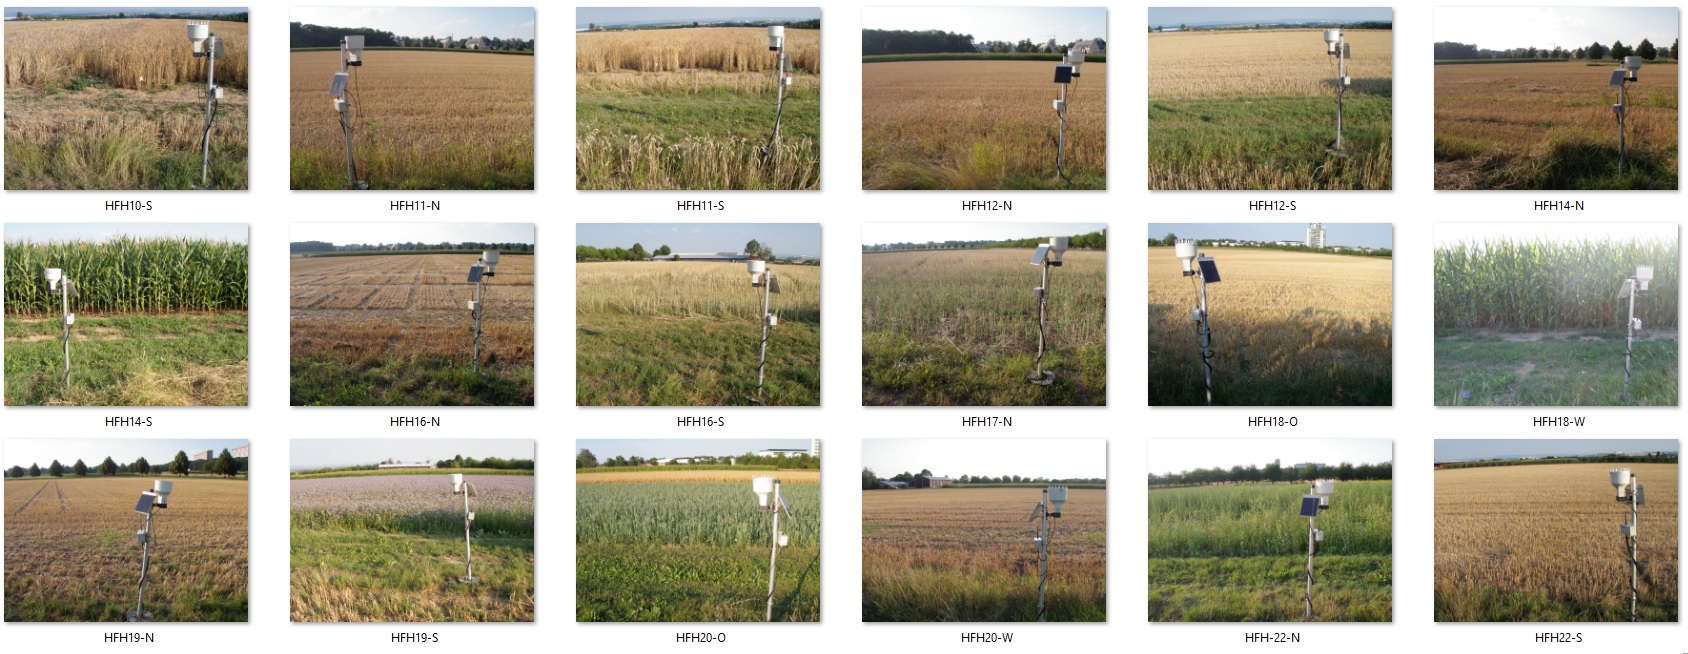
The first sensor installation was initiated in 2017, and the data are available since June 2018. The sensor data include the measurements from two eddy covariance stations (“EC-N” and “EC-S”) and 22 soil moisture network stations (“HFH_”).
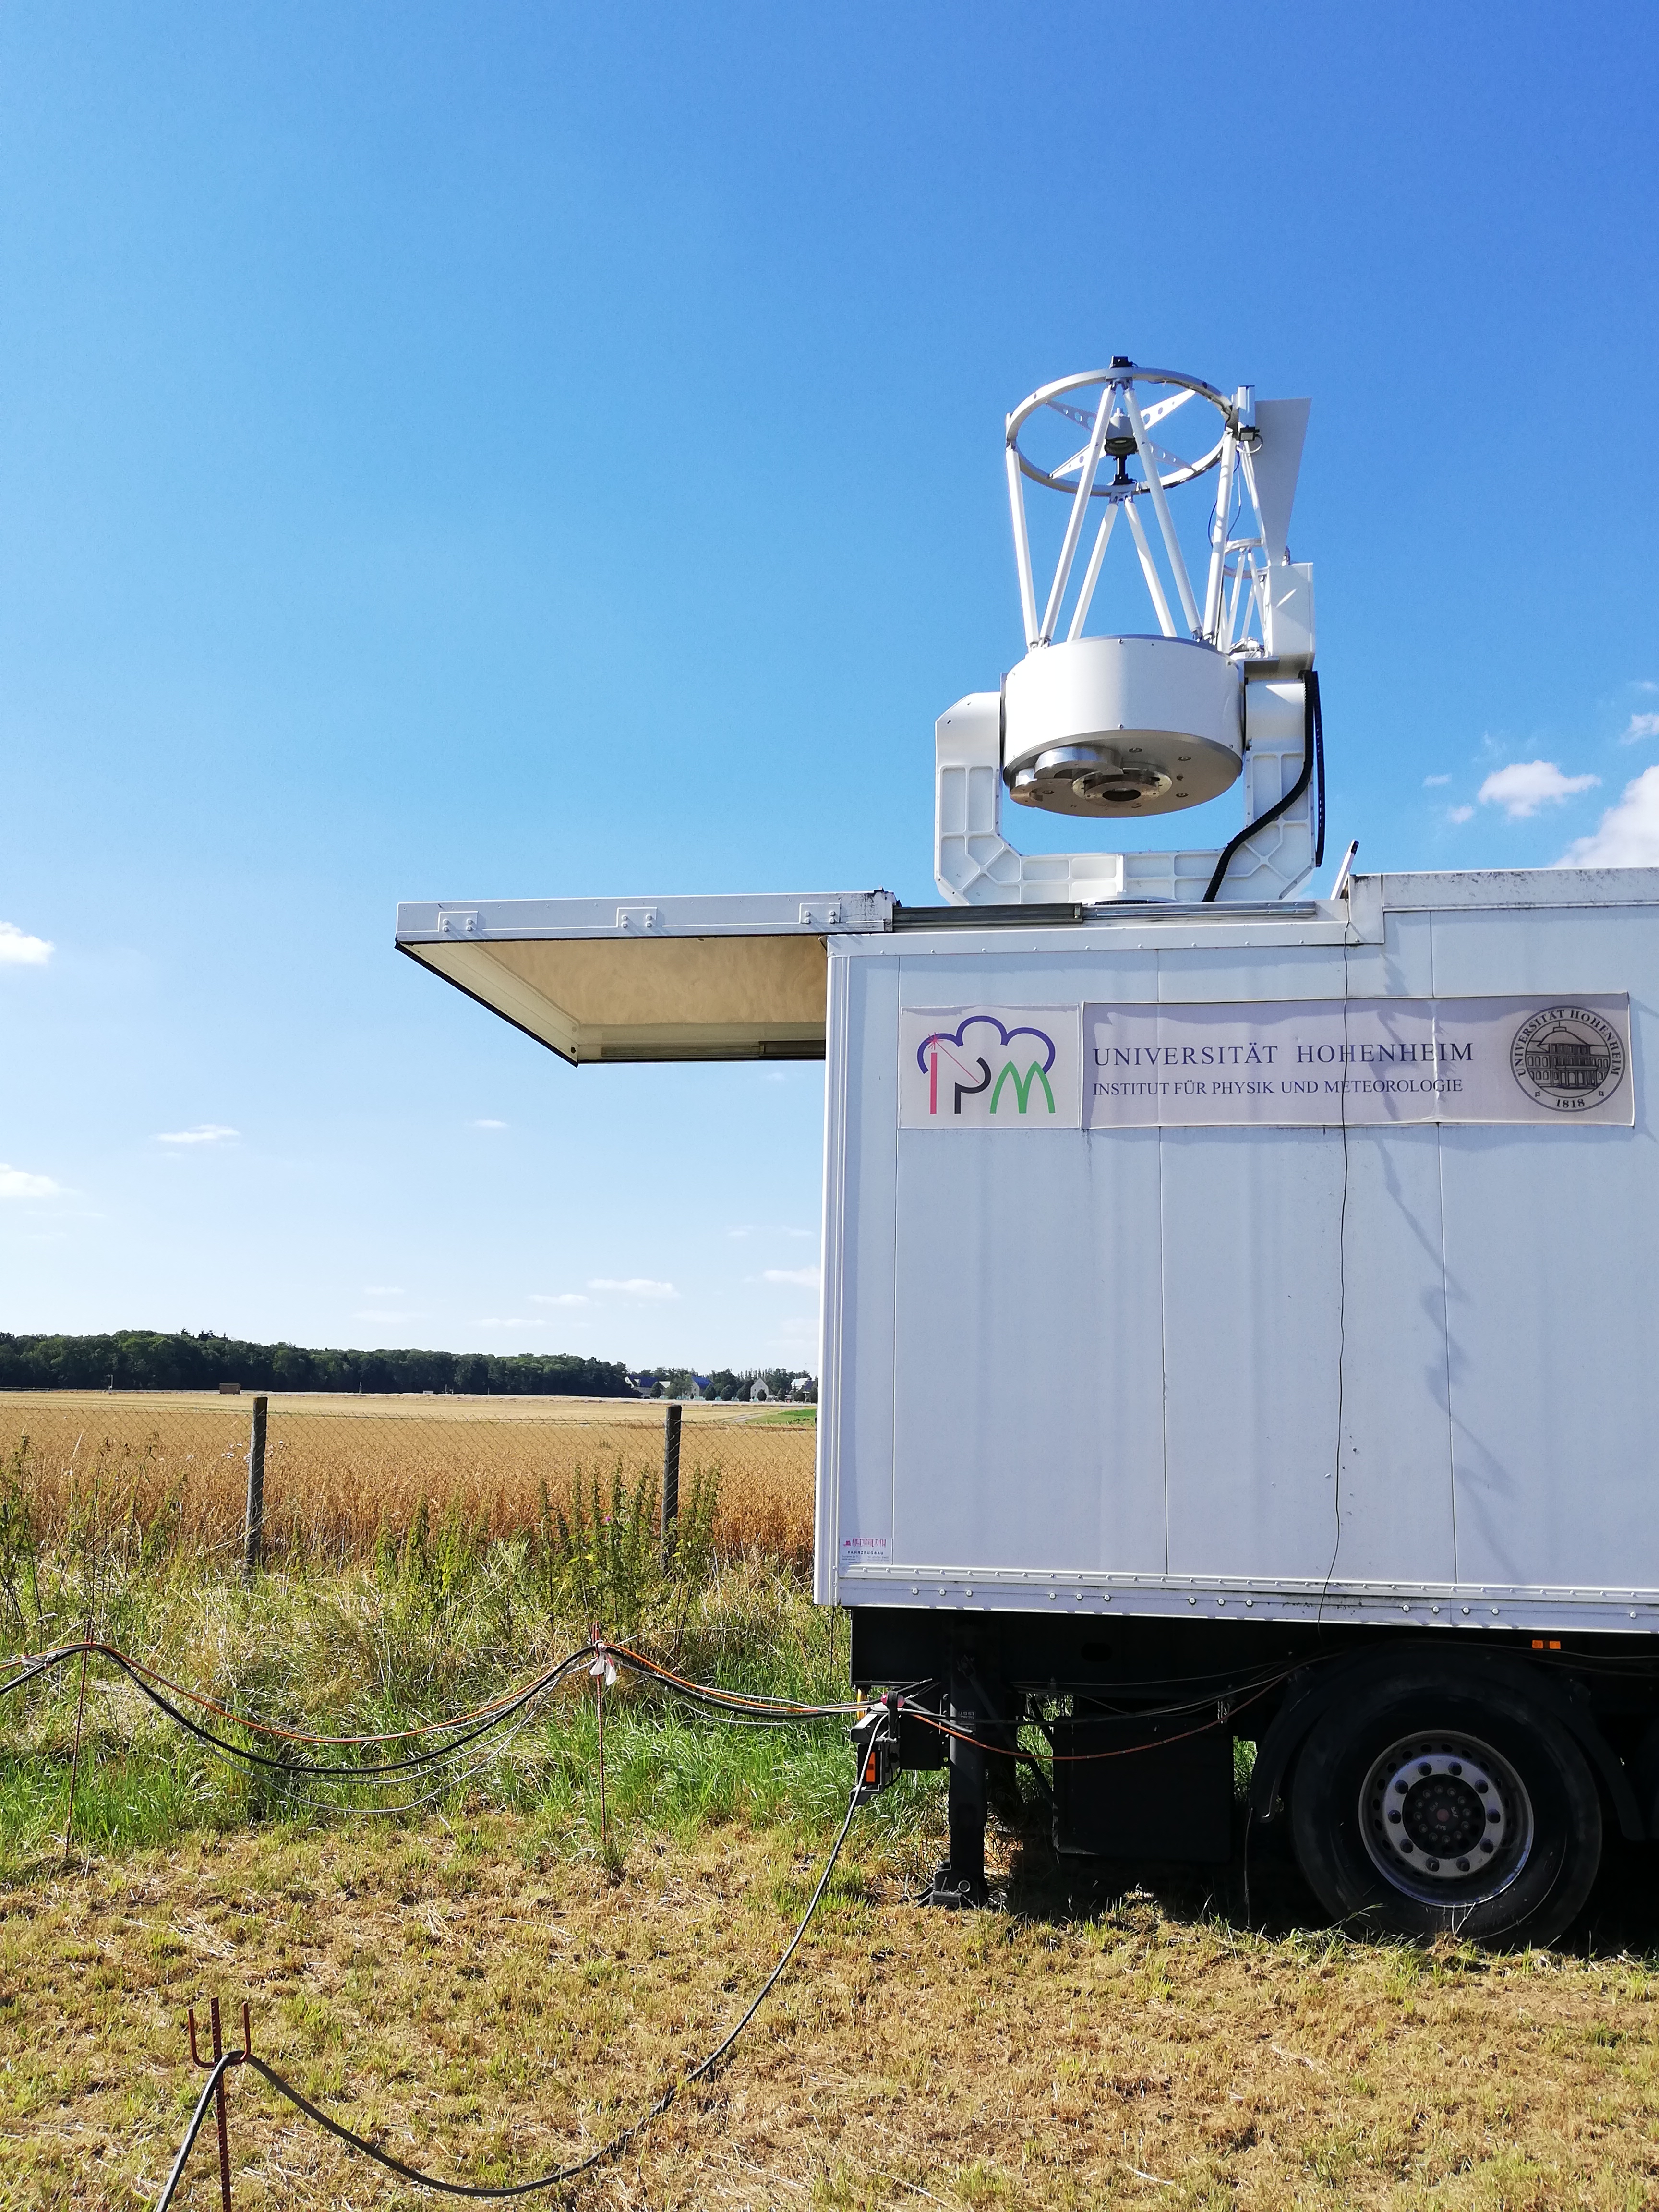
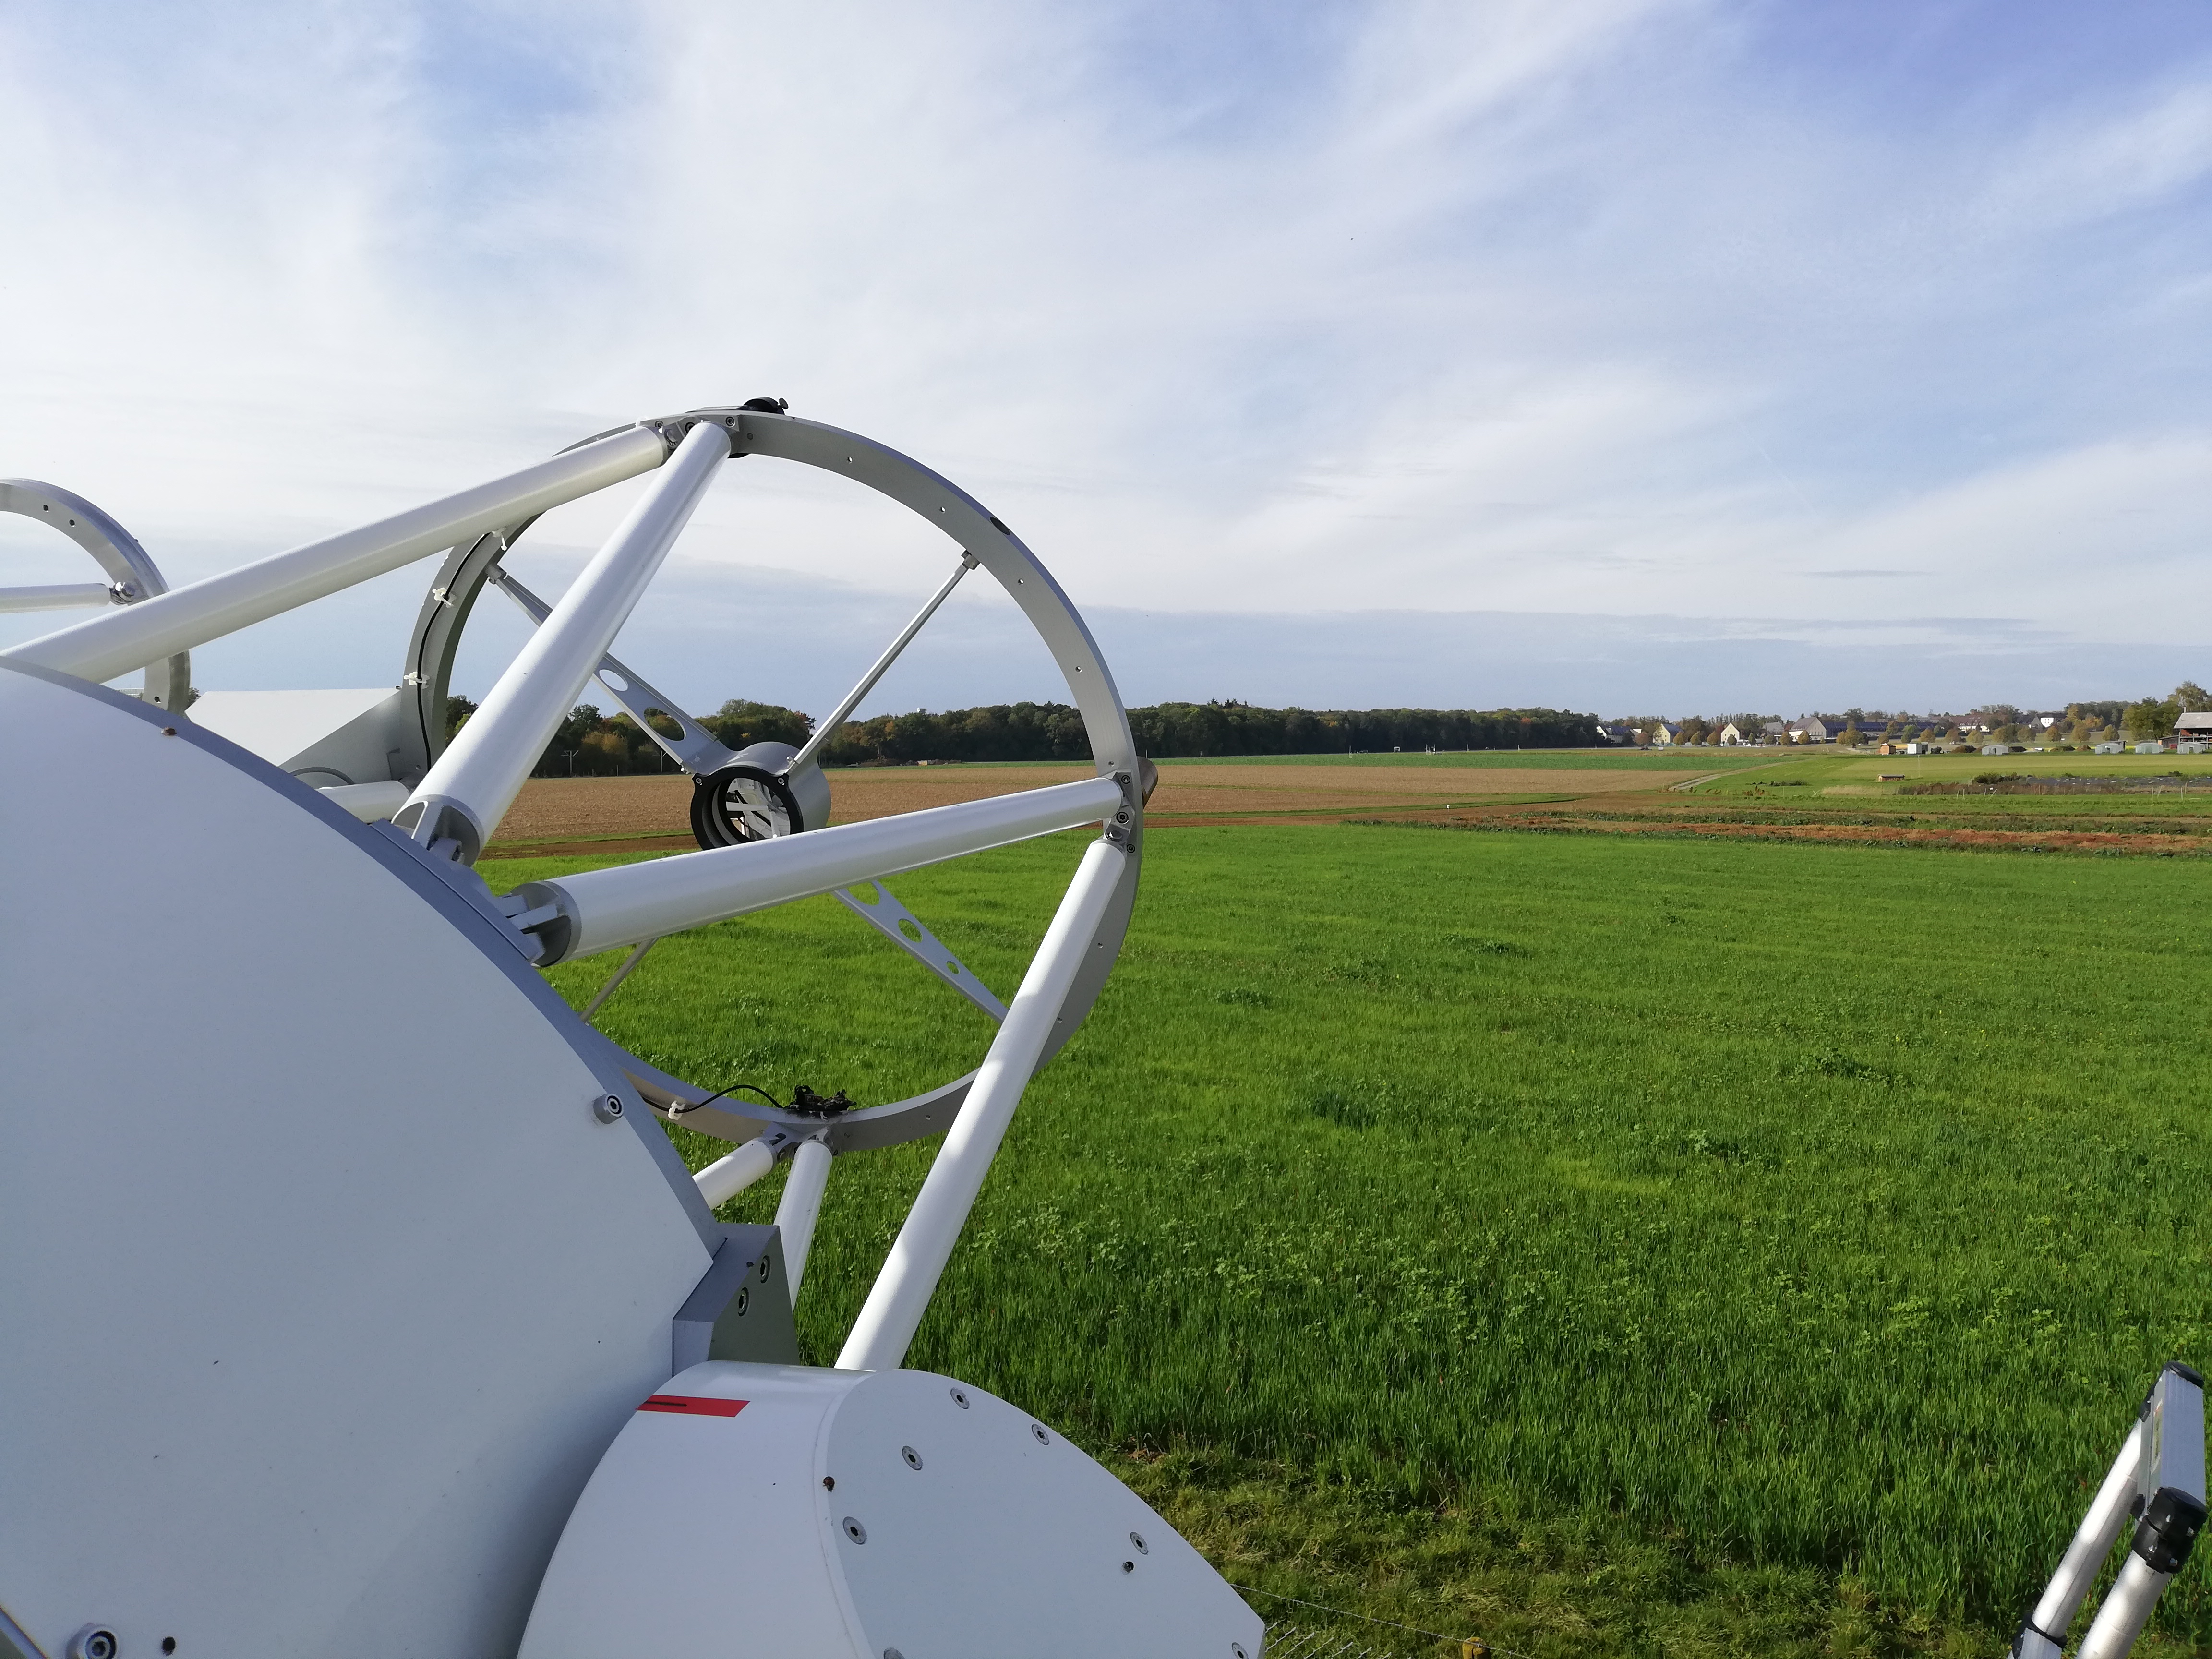
The remote sensing station, which is equipped with IPM Cloud Radar, Water Vapor Differential Absorption Lidar (WVDIAL), Temperature Rotational Raman Lidar (TRRL), Micro Rain Radar, and a Distrometer for collecting weather data from atmospheric dynamics.
In addition to sensor data, filed campaigns are conducted to measure soil moisture, soil bulk densities, soil water retention data, and geophysical measurements (EM38).
Soil moisture network
1
Remote sensing
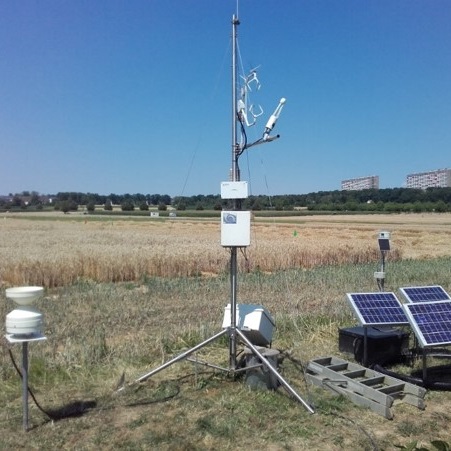
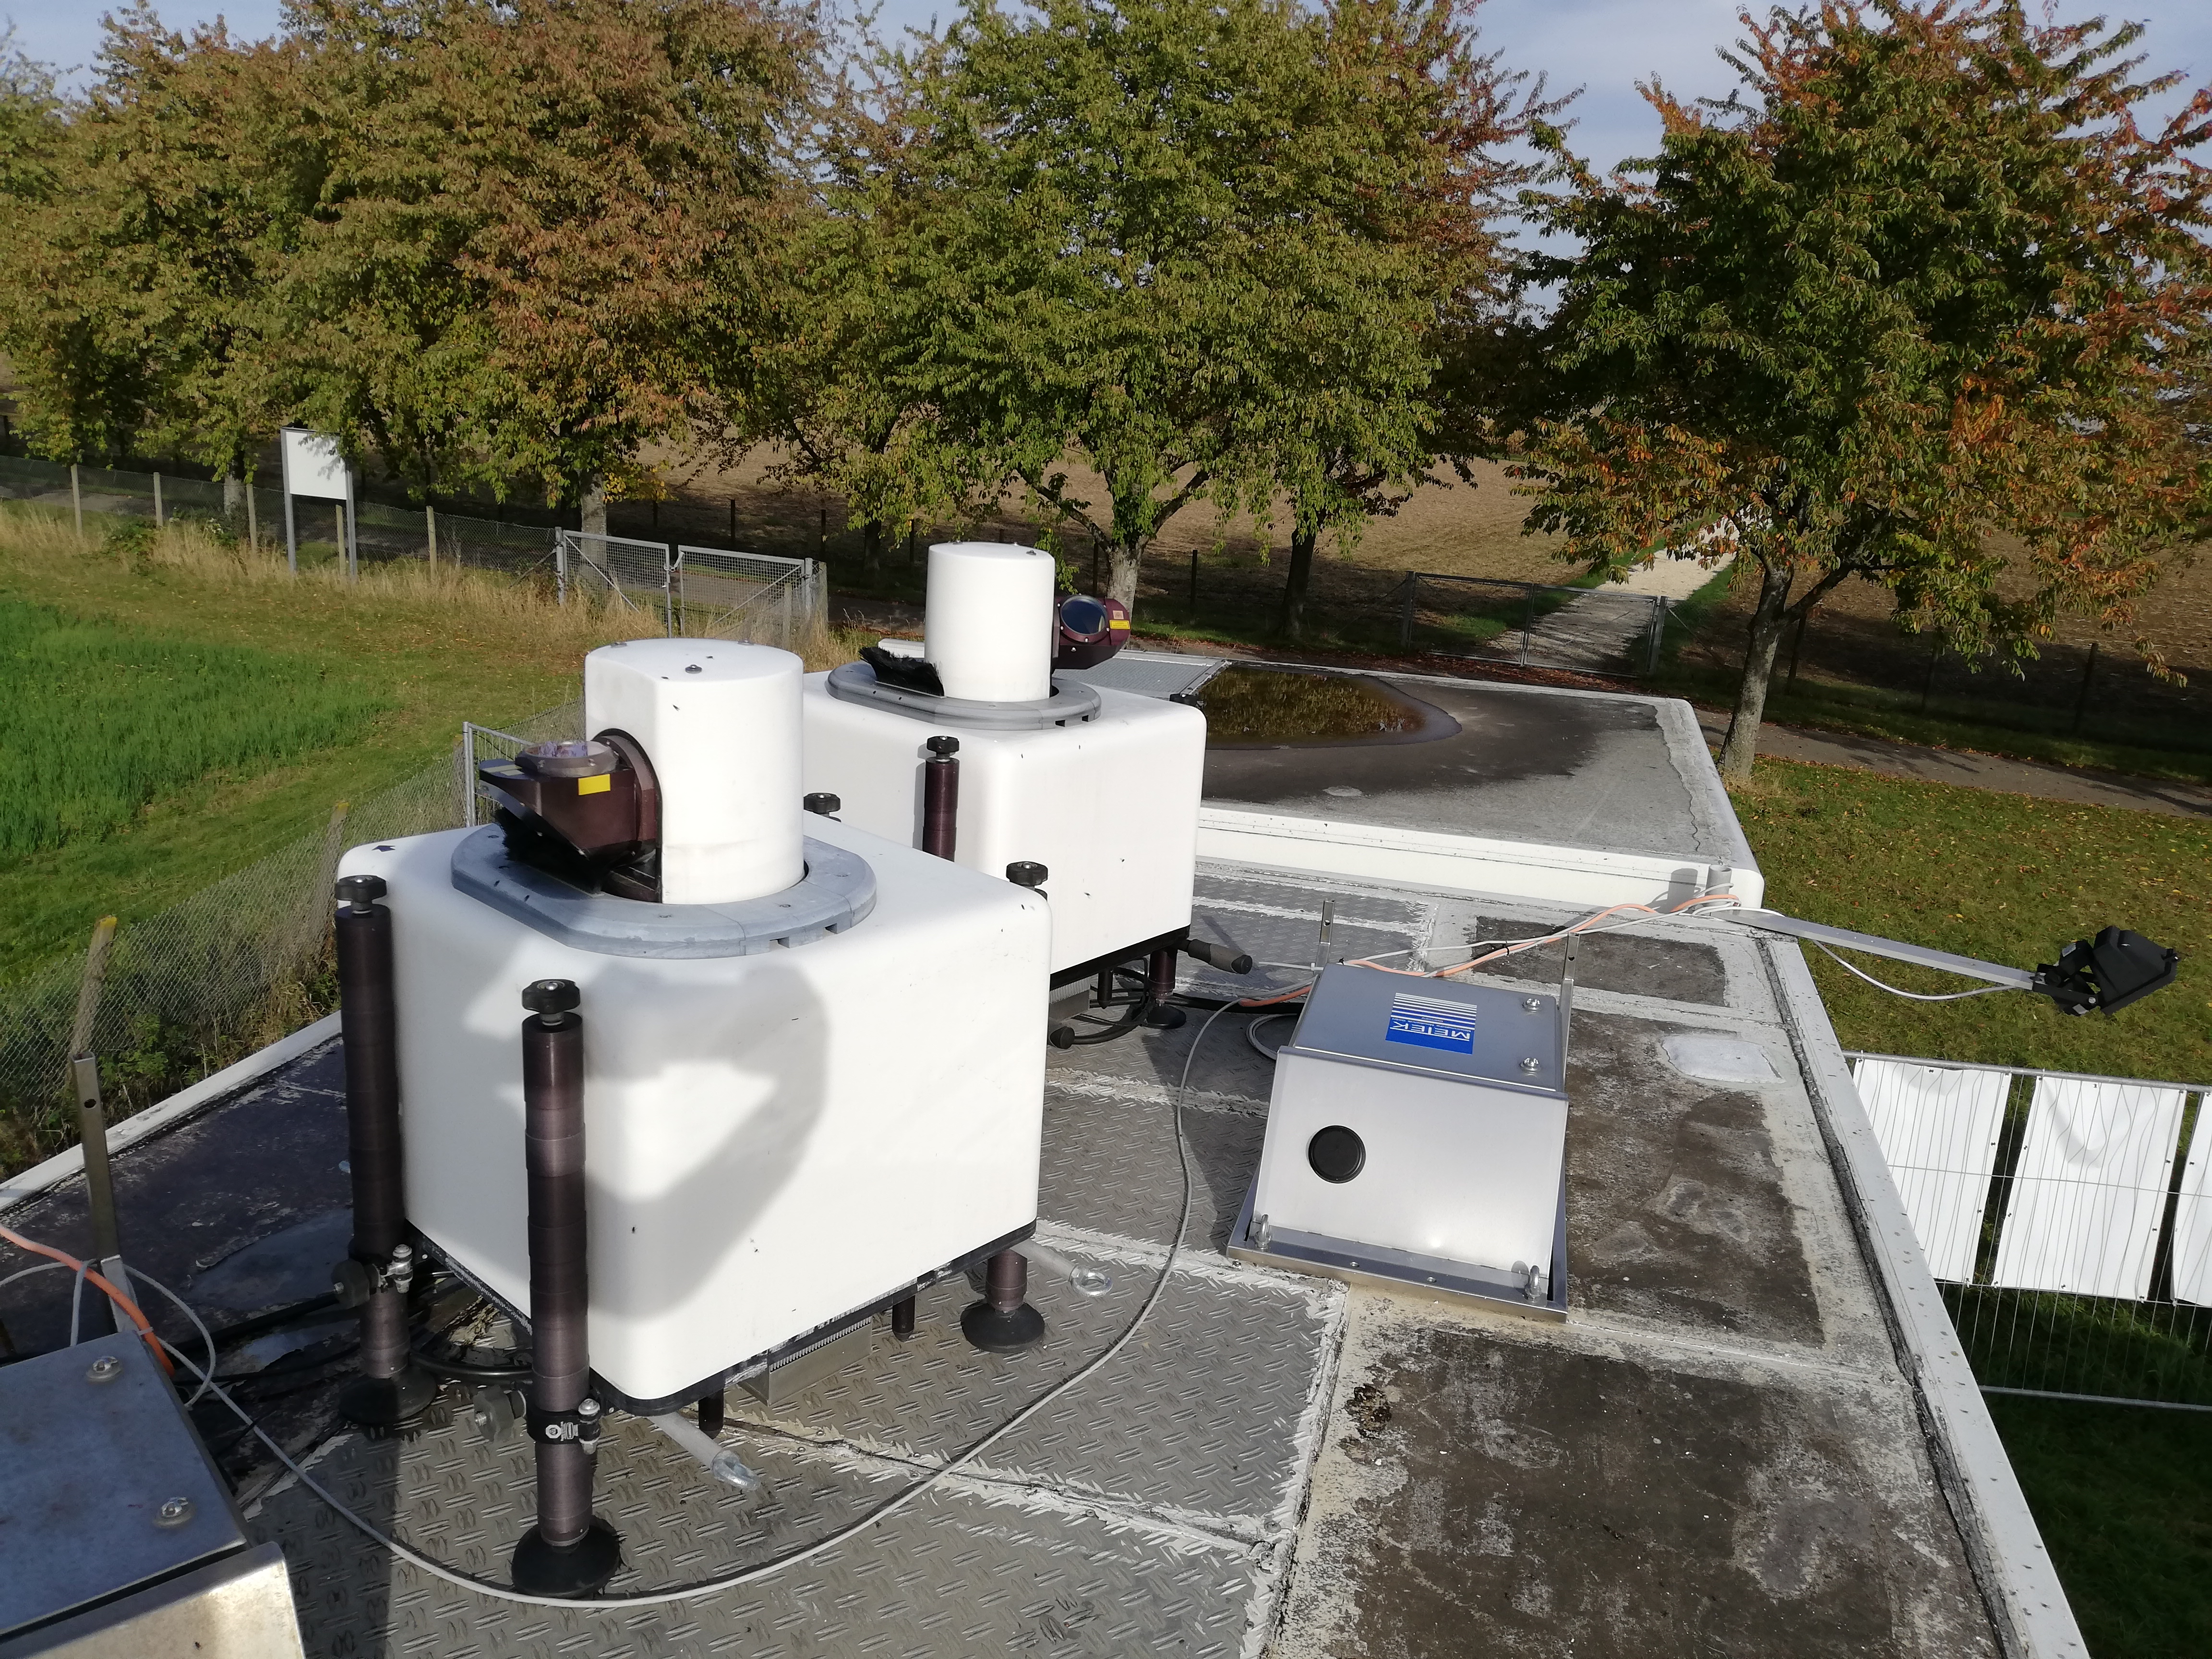
Eddy covariance Stations
Crop Management
Overview
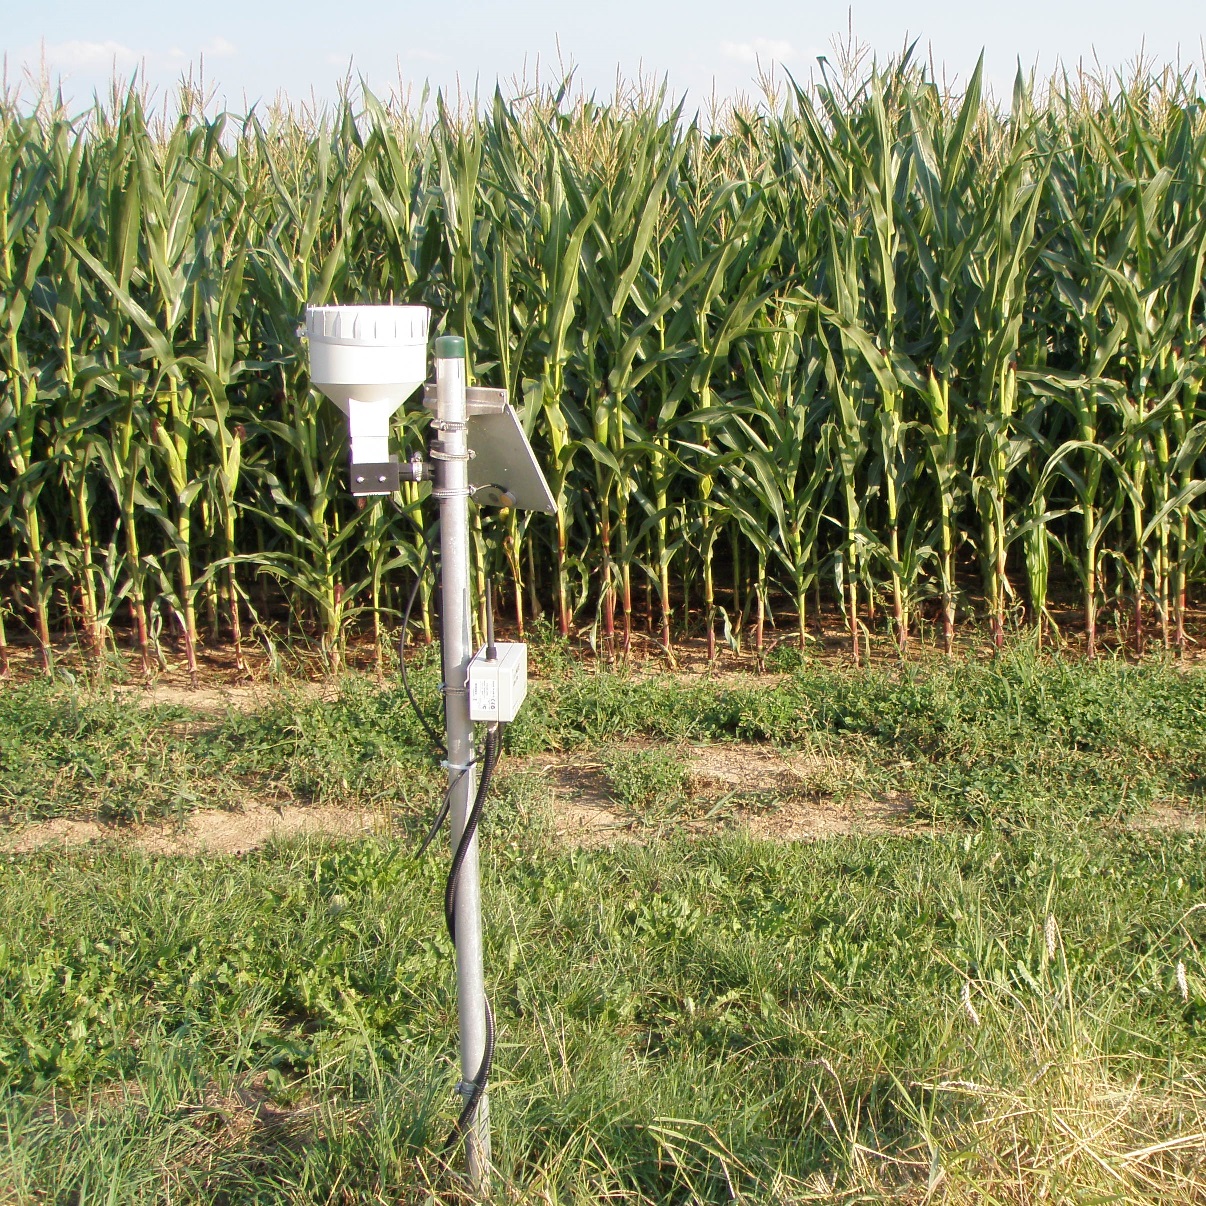
| The soil moisture network stations have been operated since June 2018 and consist of 22 stations that are located throughout the experimental site. Each station is equipped with a tipping bucket rain gauge and soil moisture and temperature sensor (Aquaflex 11). Soil moisture and temperature sensors are installed at 40 cm depth. The network records precipitation, soil temperature, and volumetric water content data at 15-minute time intervals. All the stations' data loggers are connected to a central server via GPRS network that transmits real-time measurements using ADCON 733 RTU's (OTT HydroMet GmbH). The data in the server are updated every six hours and accessible via the A850 Telemetry Gateway. |
soil moisture |
HFH01, HFH03-1, HFH03-2, HFH04, HFH05, HFH06, HFH07, HFH08-1, HFH08-2, HFH09, HFH10, HFH11, HFH13, HFH14 , HFH15, HFH16, HFH20, HFH21 , HFH22, HFH28-1, HFH28-2, HFH29 | 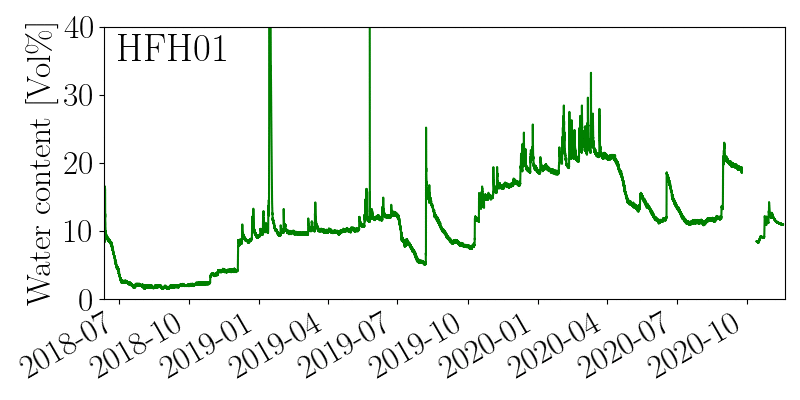 |
soil temperature |
HFH01, HFH03-1, HFH03-2, HFH04, HFH05, HFH06, HFH07, HFH08-1, HFH08-2, HFH09, HFH10, HFH11, HFH13, HFH14 , HFH15, HFH16, HFH20, HFH21 , HFH22, HFH28-1, HFH28-2, HFH29 | 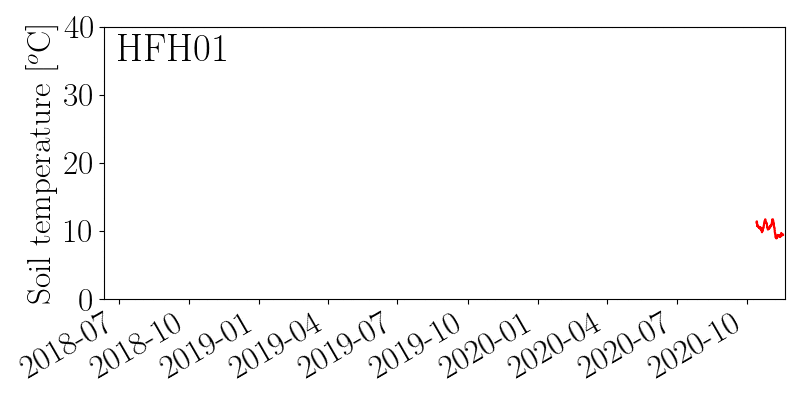 |
precipitation |
HFH01, HFH03-1, HFH03-2, HFH04, HFH05, HFH06, HFH07, HFH08-1, HFH08-2, HFH09, HFH10, HFH11, HFH13, HFH14 , HFH15, HFH16, HFH20, HFH21 , HFH22, HFH28-1, HFH28-2, HFH29 | 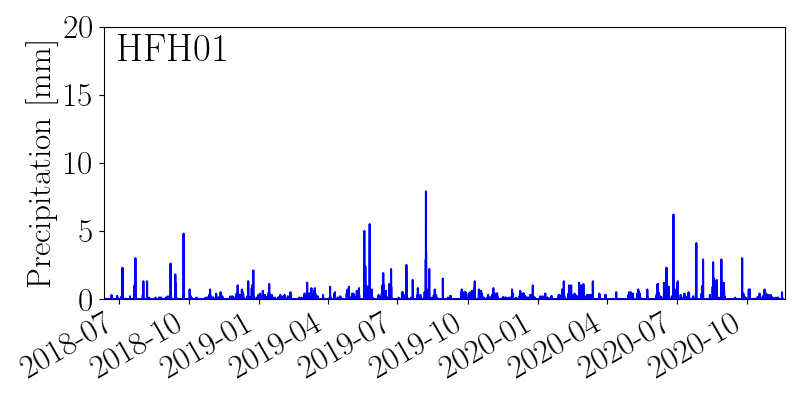 |
| Please view the EC data of the recent 7 days on our real-time quicklook plots The data will be accessible via a download portal soon. Till then, data available on request. |
 |
Instrumentation |
| Instrument | Measurement | Details |
|---|---|---|
| CSAT 3-D sonic anemometer | wind speed, direction | (Campbell Scientific Inc.) |
| LI-7500 open path infrared CO2 /H2O analyzer | CO2 concentration,H2O concentration, pressure | (Licor Biosciences) |
| 4-component net radiometer NR01 | shortwave radiation (pyranometer, 305-2800 nm), longwave radiation (pyrgeometer, 4500-50000 nm) | (Hukseflux Thermal Sensors) |
| temperature and relative humidity probe HMP45C | temperature,relative humidity | (Campbell Scientific Inc.) |
| soil temperature probe 107 Thermistor probe | soil temperature | (Campbell Scientific Inc.) |
| heat flux plates HFP01 SC | soil heat flux | (Vaisala Inc.) |
| frequency-domain reflectometry sensors CS616 | soil water content | (Campbell Scientific Inc.) |
| tipping bucket ARG 100 | precipitation | (Environmental Measurements Ltd.) |
| Tensiomark | soil water potential, temperature | ecoTech Umwelt-Meßsysteme GmbH |
High- frequency gas analyzer and sonic anemometer measurements
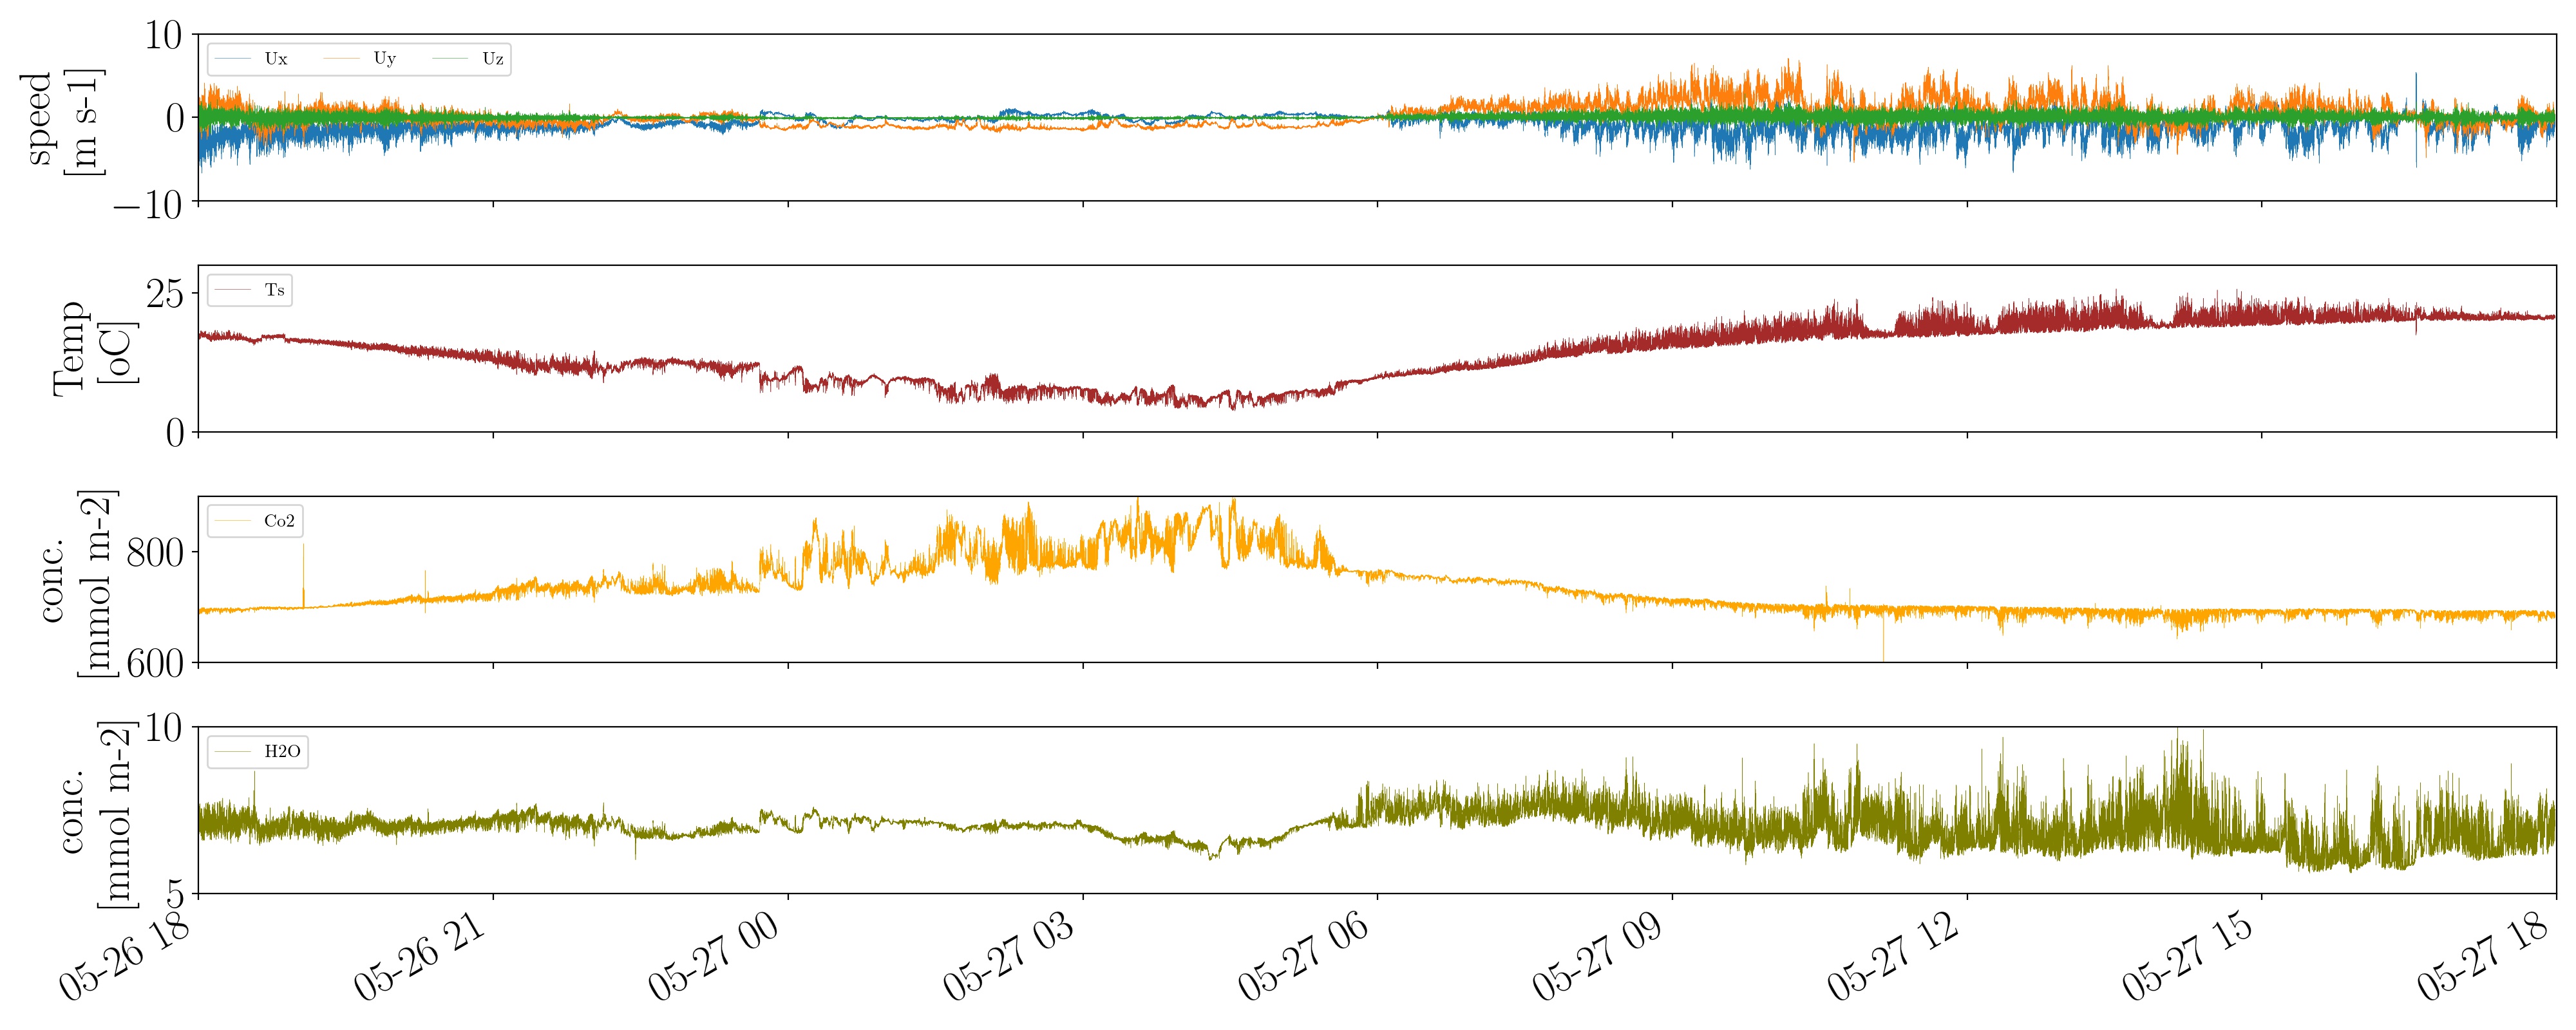
| High-frequency raw eddy covariance data are processed and quality controlled using TK31 software (Mauder and Foken, 2011). The processed EC data are organized as weather and flux data at 30-minute time intervals. Soil data are also collected next to each station by soil sensors that are installed up to 75 m in the soil profile. |
| weather (EC-N, EC-S) | wind speed, wind direction, air temperature, humidity, atmospheric pressure, net radiation, albedo, precipitation |
| flux (EC-N, EC-S) | net ecosystem exchange of CO2, sensible heat flux,latent heat flux net radiation, soil heat flux, ground heat flux,soil heat storage |
| soil (EC-N, EC-S) | soil temperature, water content, matrix potential |
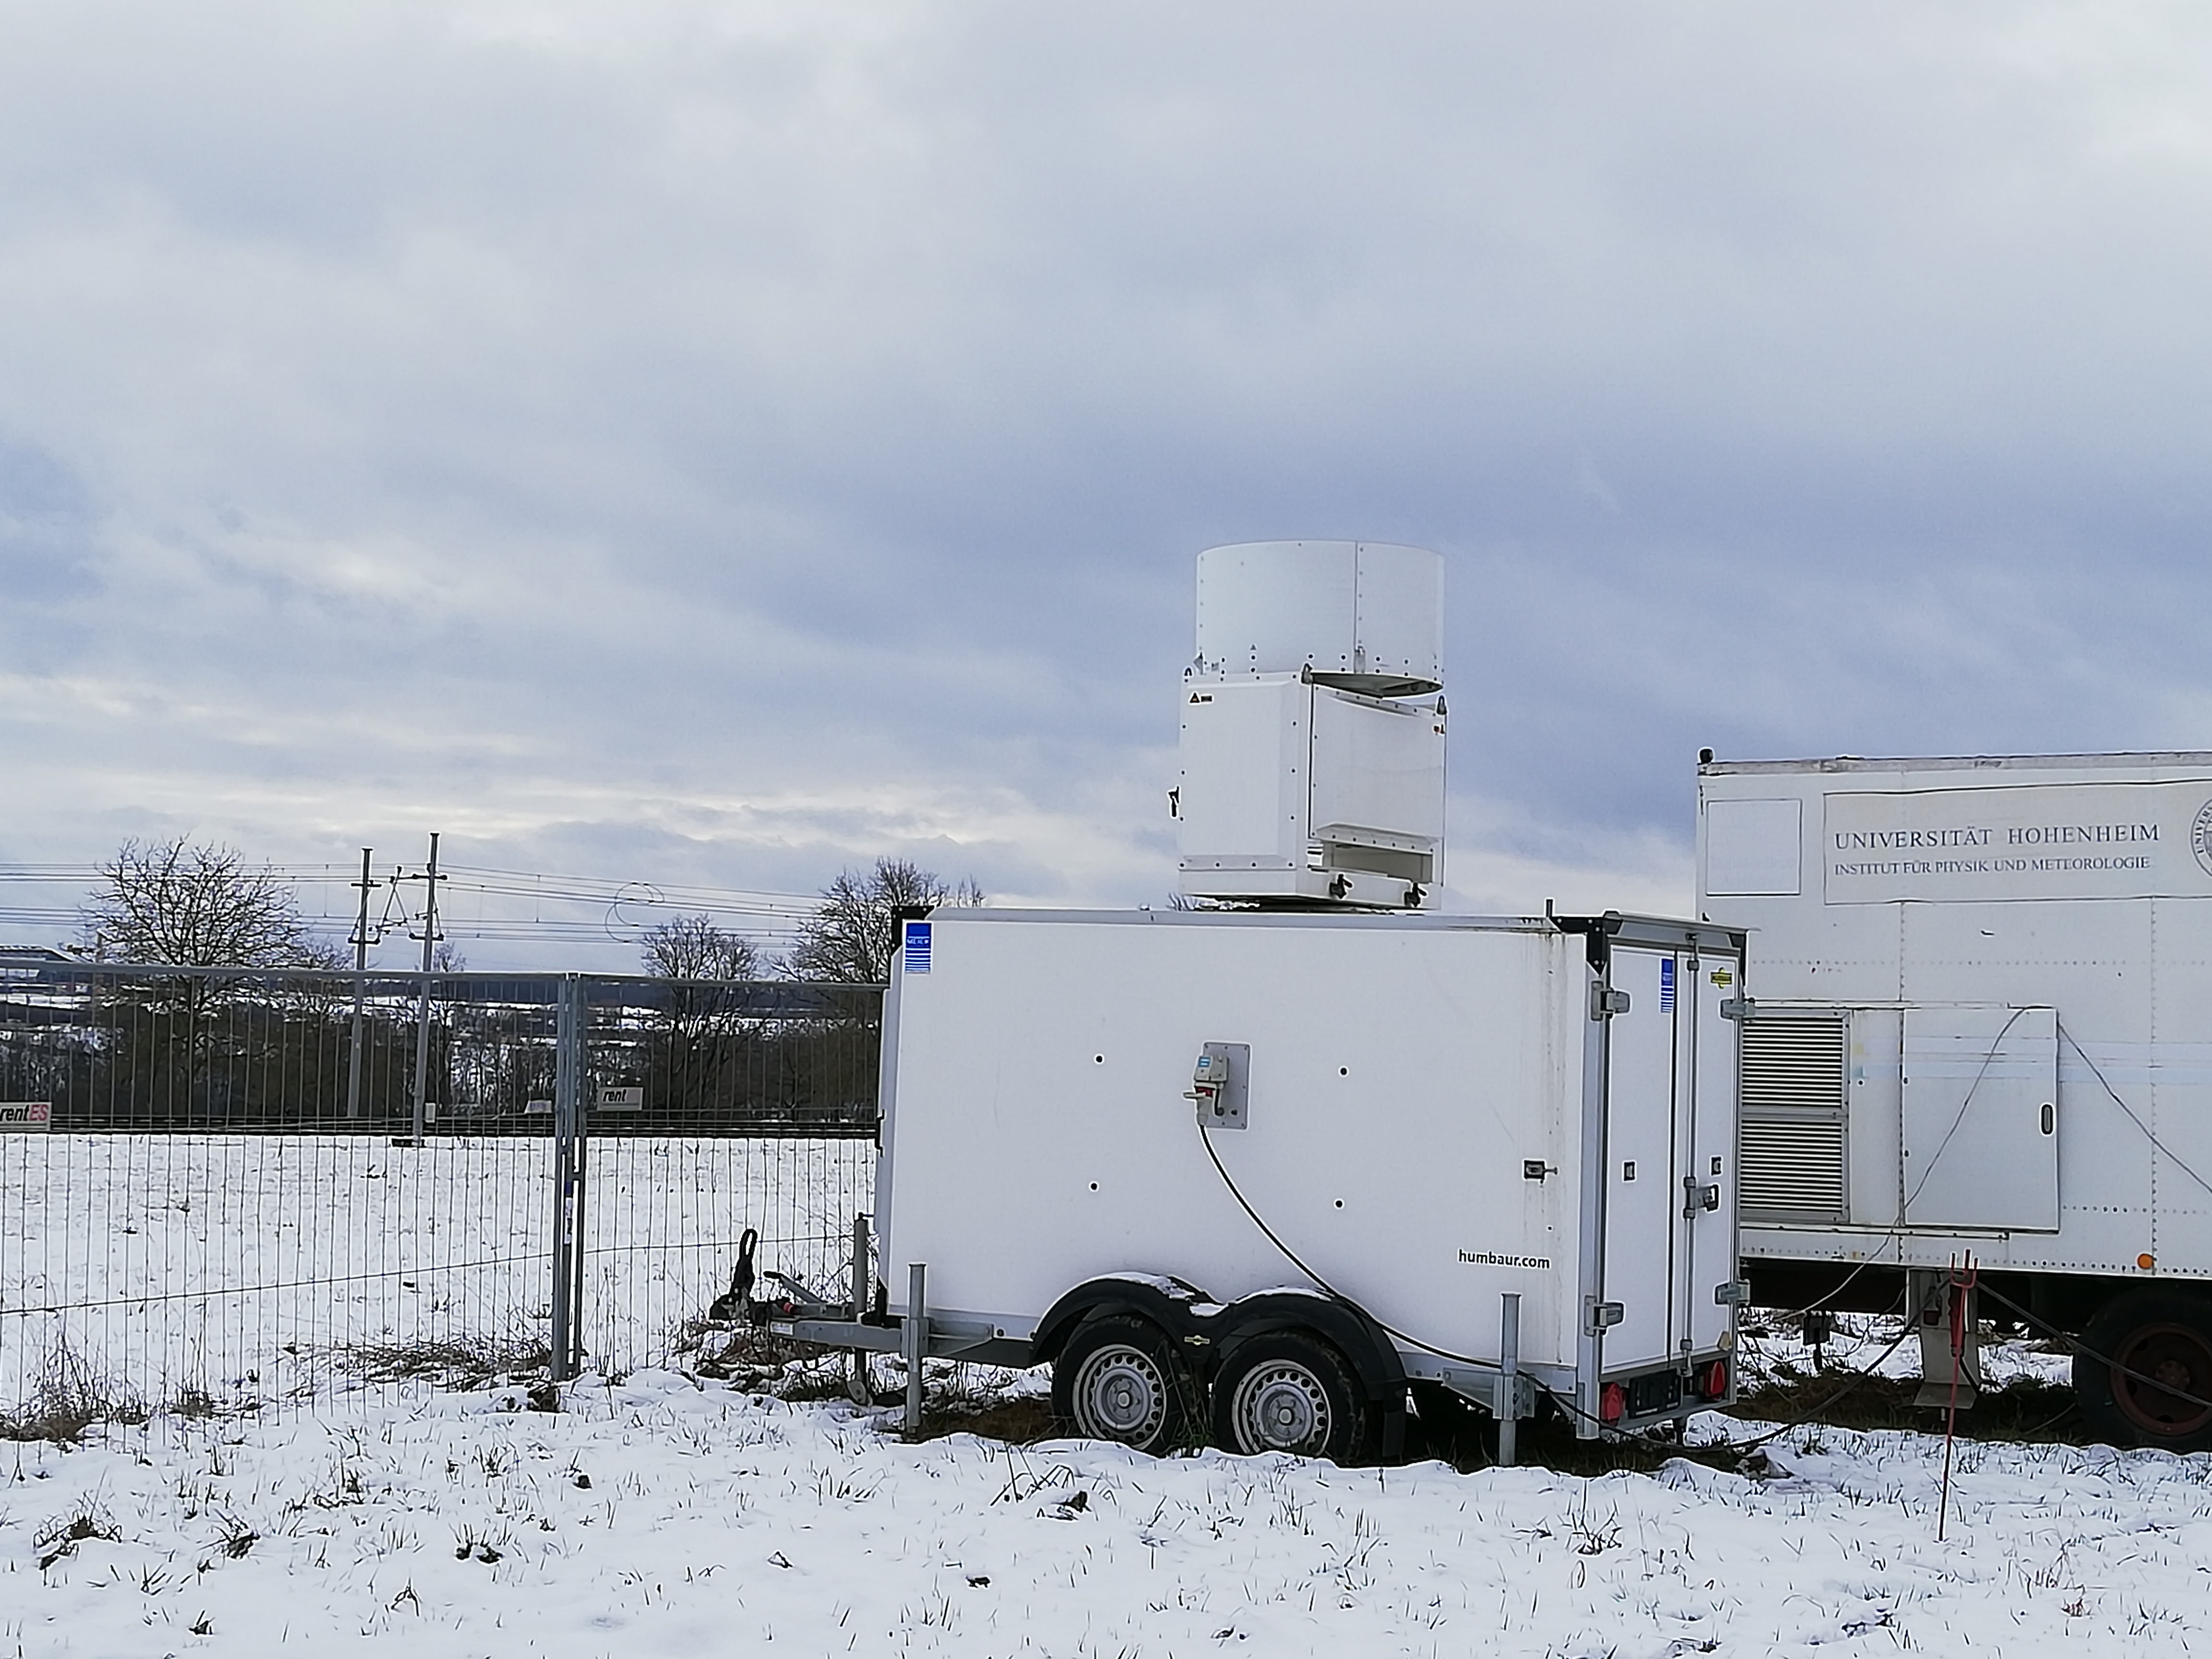
| At LAFO, two scanning Doppler lidars (DLs) are operated in operational mode.
Both are Halo Photonics Stream Line XR.One DL pointing constantly vertical to sample the vertical wind.
The other DL performs the 6-beam VAD scan pattern to retrieve vertical profiles of horizontal wind speed, wind direction and turbulent kinetic energy (TKE) etc.
In addition to the Doppler wind, the backscatter signal and the SNR is recorded as well.
Please view the vertical wind profiles on our real-time quicklook page The data will be accessible via a download portal soon. Till then, data available on request. |
 |
| Variable | Temporal resolution | Spatial resolution | Range |
|---|---|---|---|
| Vertical wind | 1 s | 30 m | 0-10 km |
| TKE | 90 s | 30 m | 0-8 km |
| Backscatter | 1 s | 30 m | 0-10 km |
| 90 s | 30 m | 0-8 km | |
| SNR | 1 s | 30 m | 0-10 km |
| 90 s | 30 m | 0-8 km |
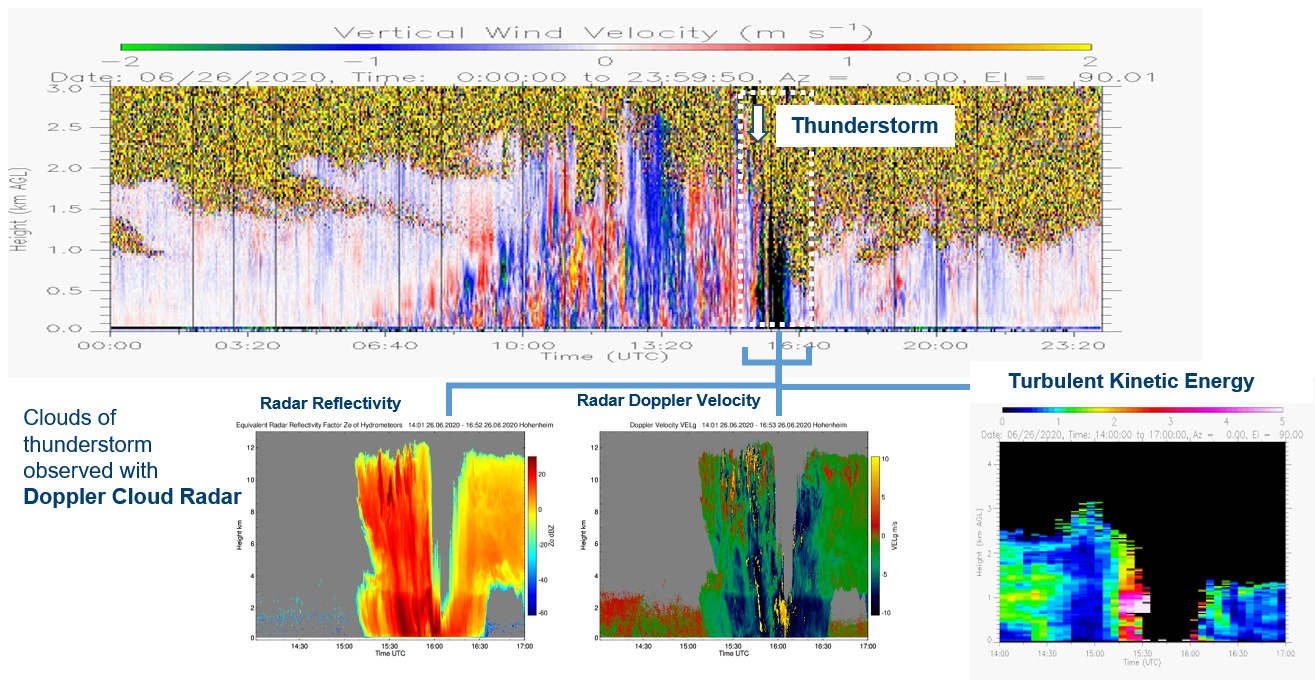
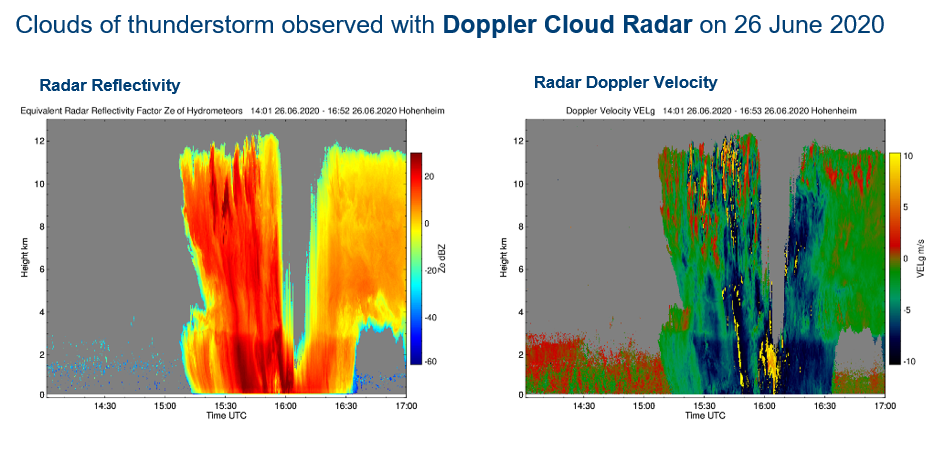
| We are operating a scanning Doppler Cloud Radar of Metek company. The standard measurement mode is pointing vertically collecting radar reflectivity, Doppler velocity, peak width rms, skewness, linear de-polarization, cross channel correlation peak width weighted and differential phase.
Please view the radar products on our real-time quicklook page The data will be accessible via a download portal soon. Till then, data available on request. |
 |
| Variable | Temporal resolution | Spatial resolution | Range |
|---|---|---|---|
| radar reflectivity | 1 s | 30 min | 0-13 km |
| Doppler velocity | 1 s | 30 m | 0-13 km |
| peak width rms | 1 s | 30 m | 0-13 km |
| skewness | 1 s | 30 m | 0-13 km |
| linear de-polarization | 1 s | 30 m | 0-13 km |
| cross channel correlation peak width weighted | 1 s | 30 m | 0-13 km |
| differential phase | 1 s | 30 m | 0-13 km |
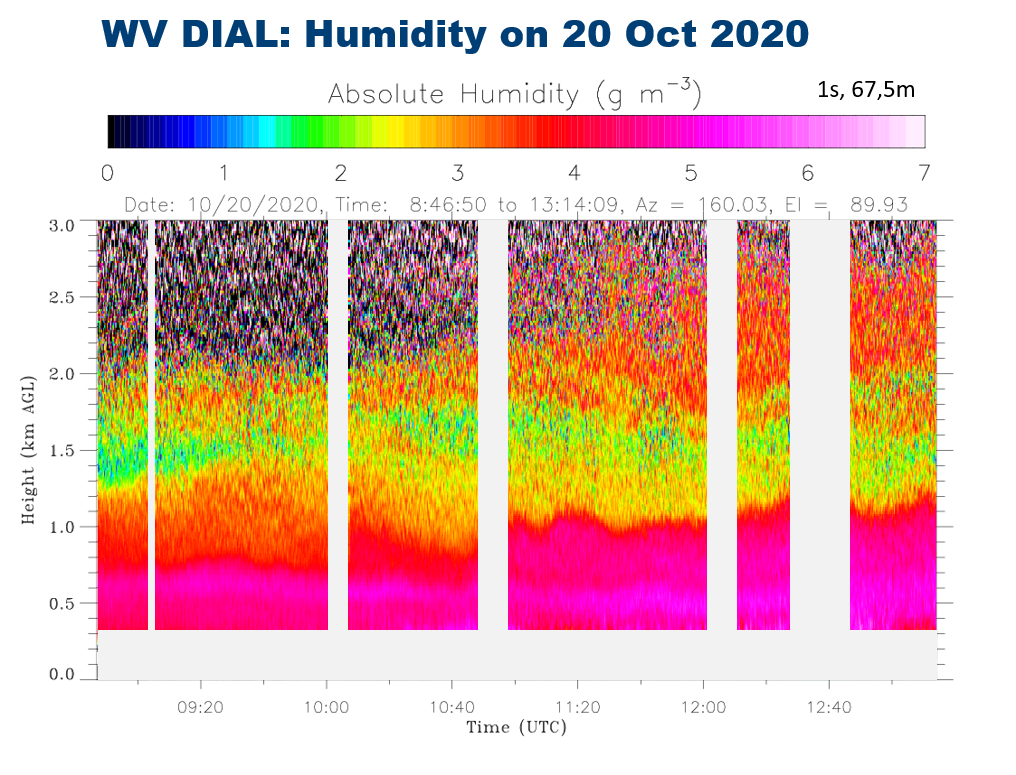
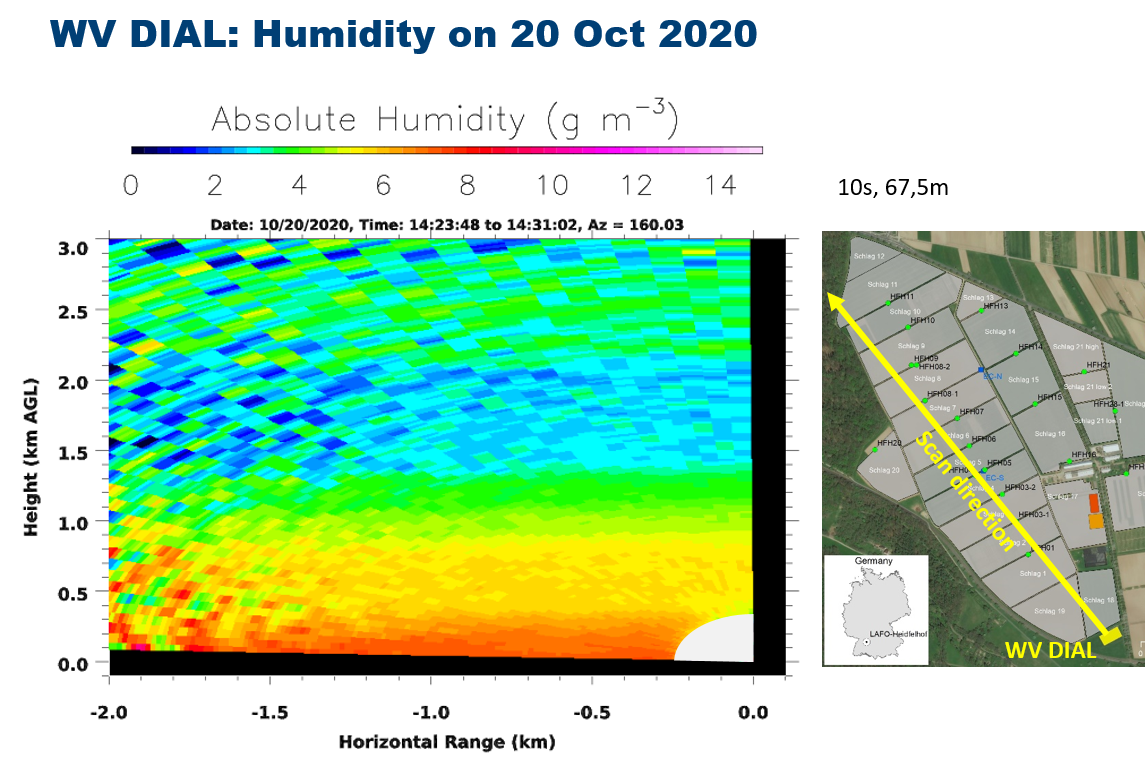
| We developed and operate our scanning DIAL to observe the absolute humidity in the lower troposphere with turbulence resolving capability.
With the DIAL we can operate in vertical pointing mode to capture humidity and its higher-order moments (variance, 3rd order moment, skewness, 4th order moment, kurtosis) as well as performing RHI and PPI scans.
The WV DIAL is operated during campaigns.
The data data available on request. |
 |
| Variable | Temporal resolution | Spatial resolution | Range |
|---|---|---|---|
| Absolute humidity | 1-10 s | 60-300 m | 0-10 km |
| Backscatter signal at 818 nm | 1-10 s | 60-300 m | 0-10 km |
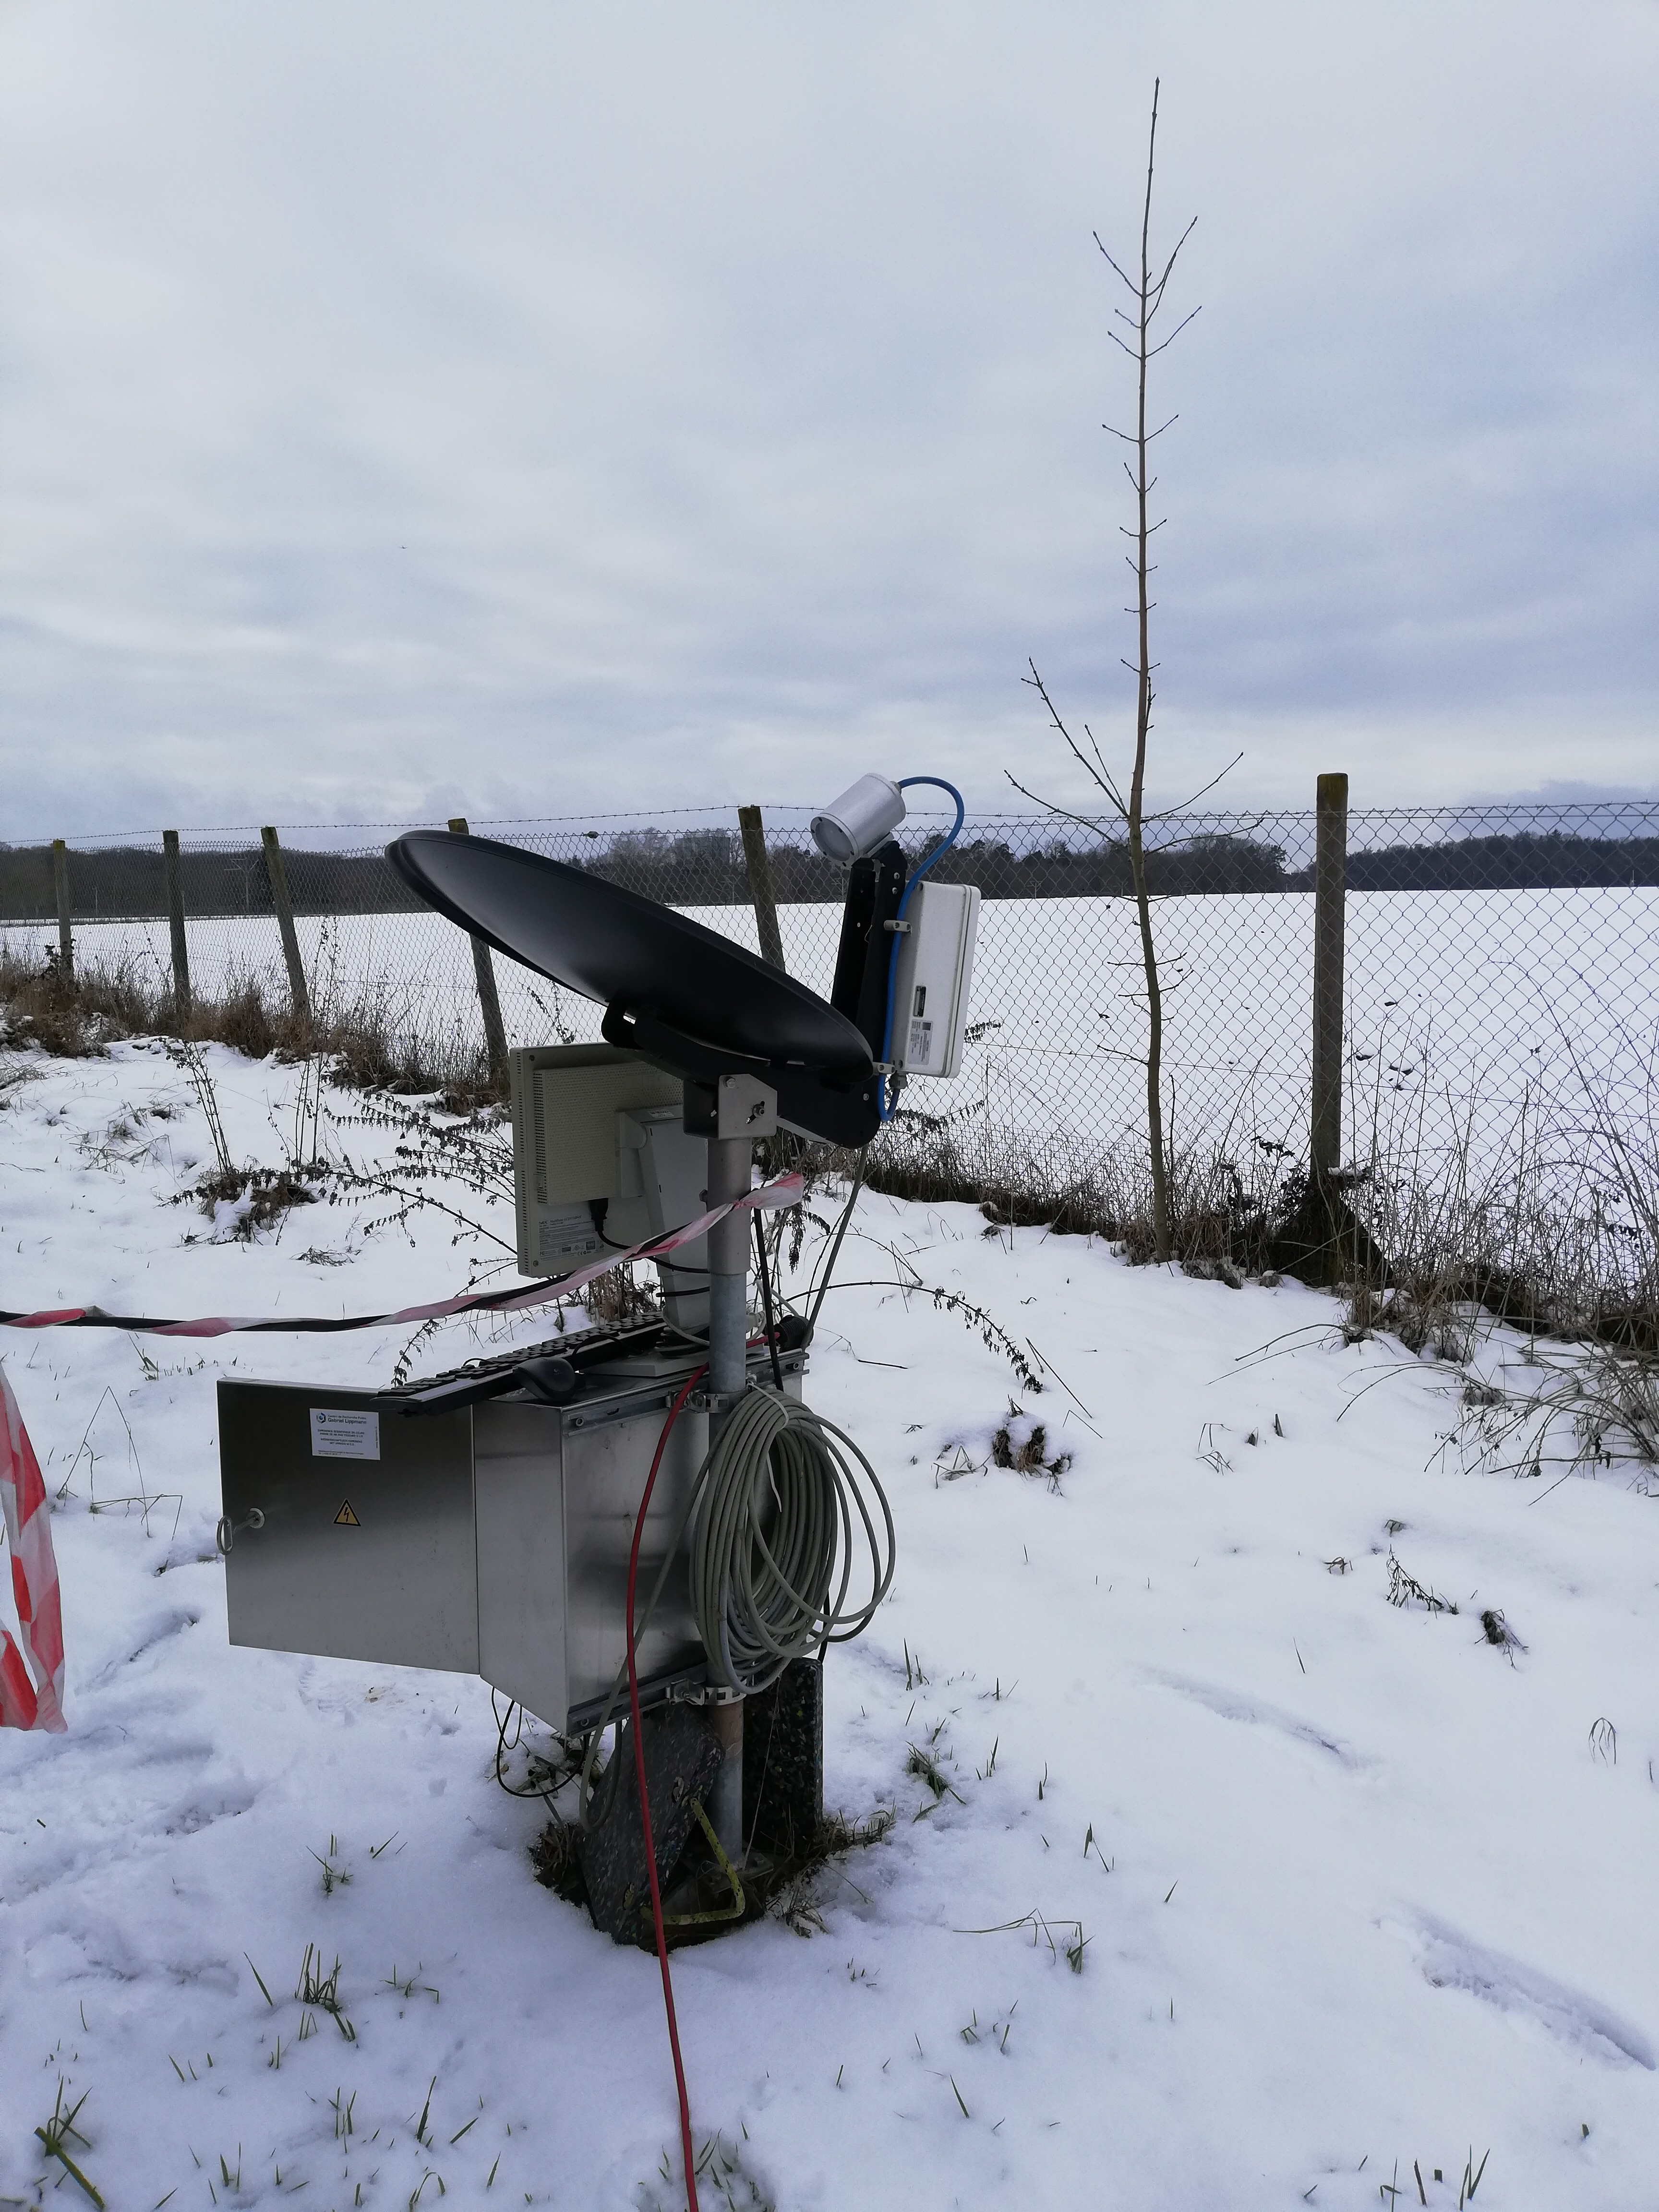
| A micro rain radar of Metek company is operated at the LAFO remote sensing site.
The data will be accessible via a download portal soon. Till then, data available on request. |
 |
| Variable | Temporal resolution | Spatial resolution | Range |
|---|---|---|---|
| Drop size distribution | 1 min | 100 m | |
| Drop fall velocity | 1 min | 100 m | |
| Rain rate | 1 min |
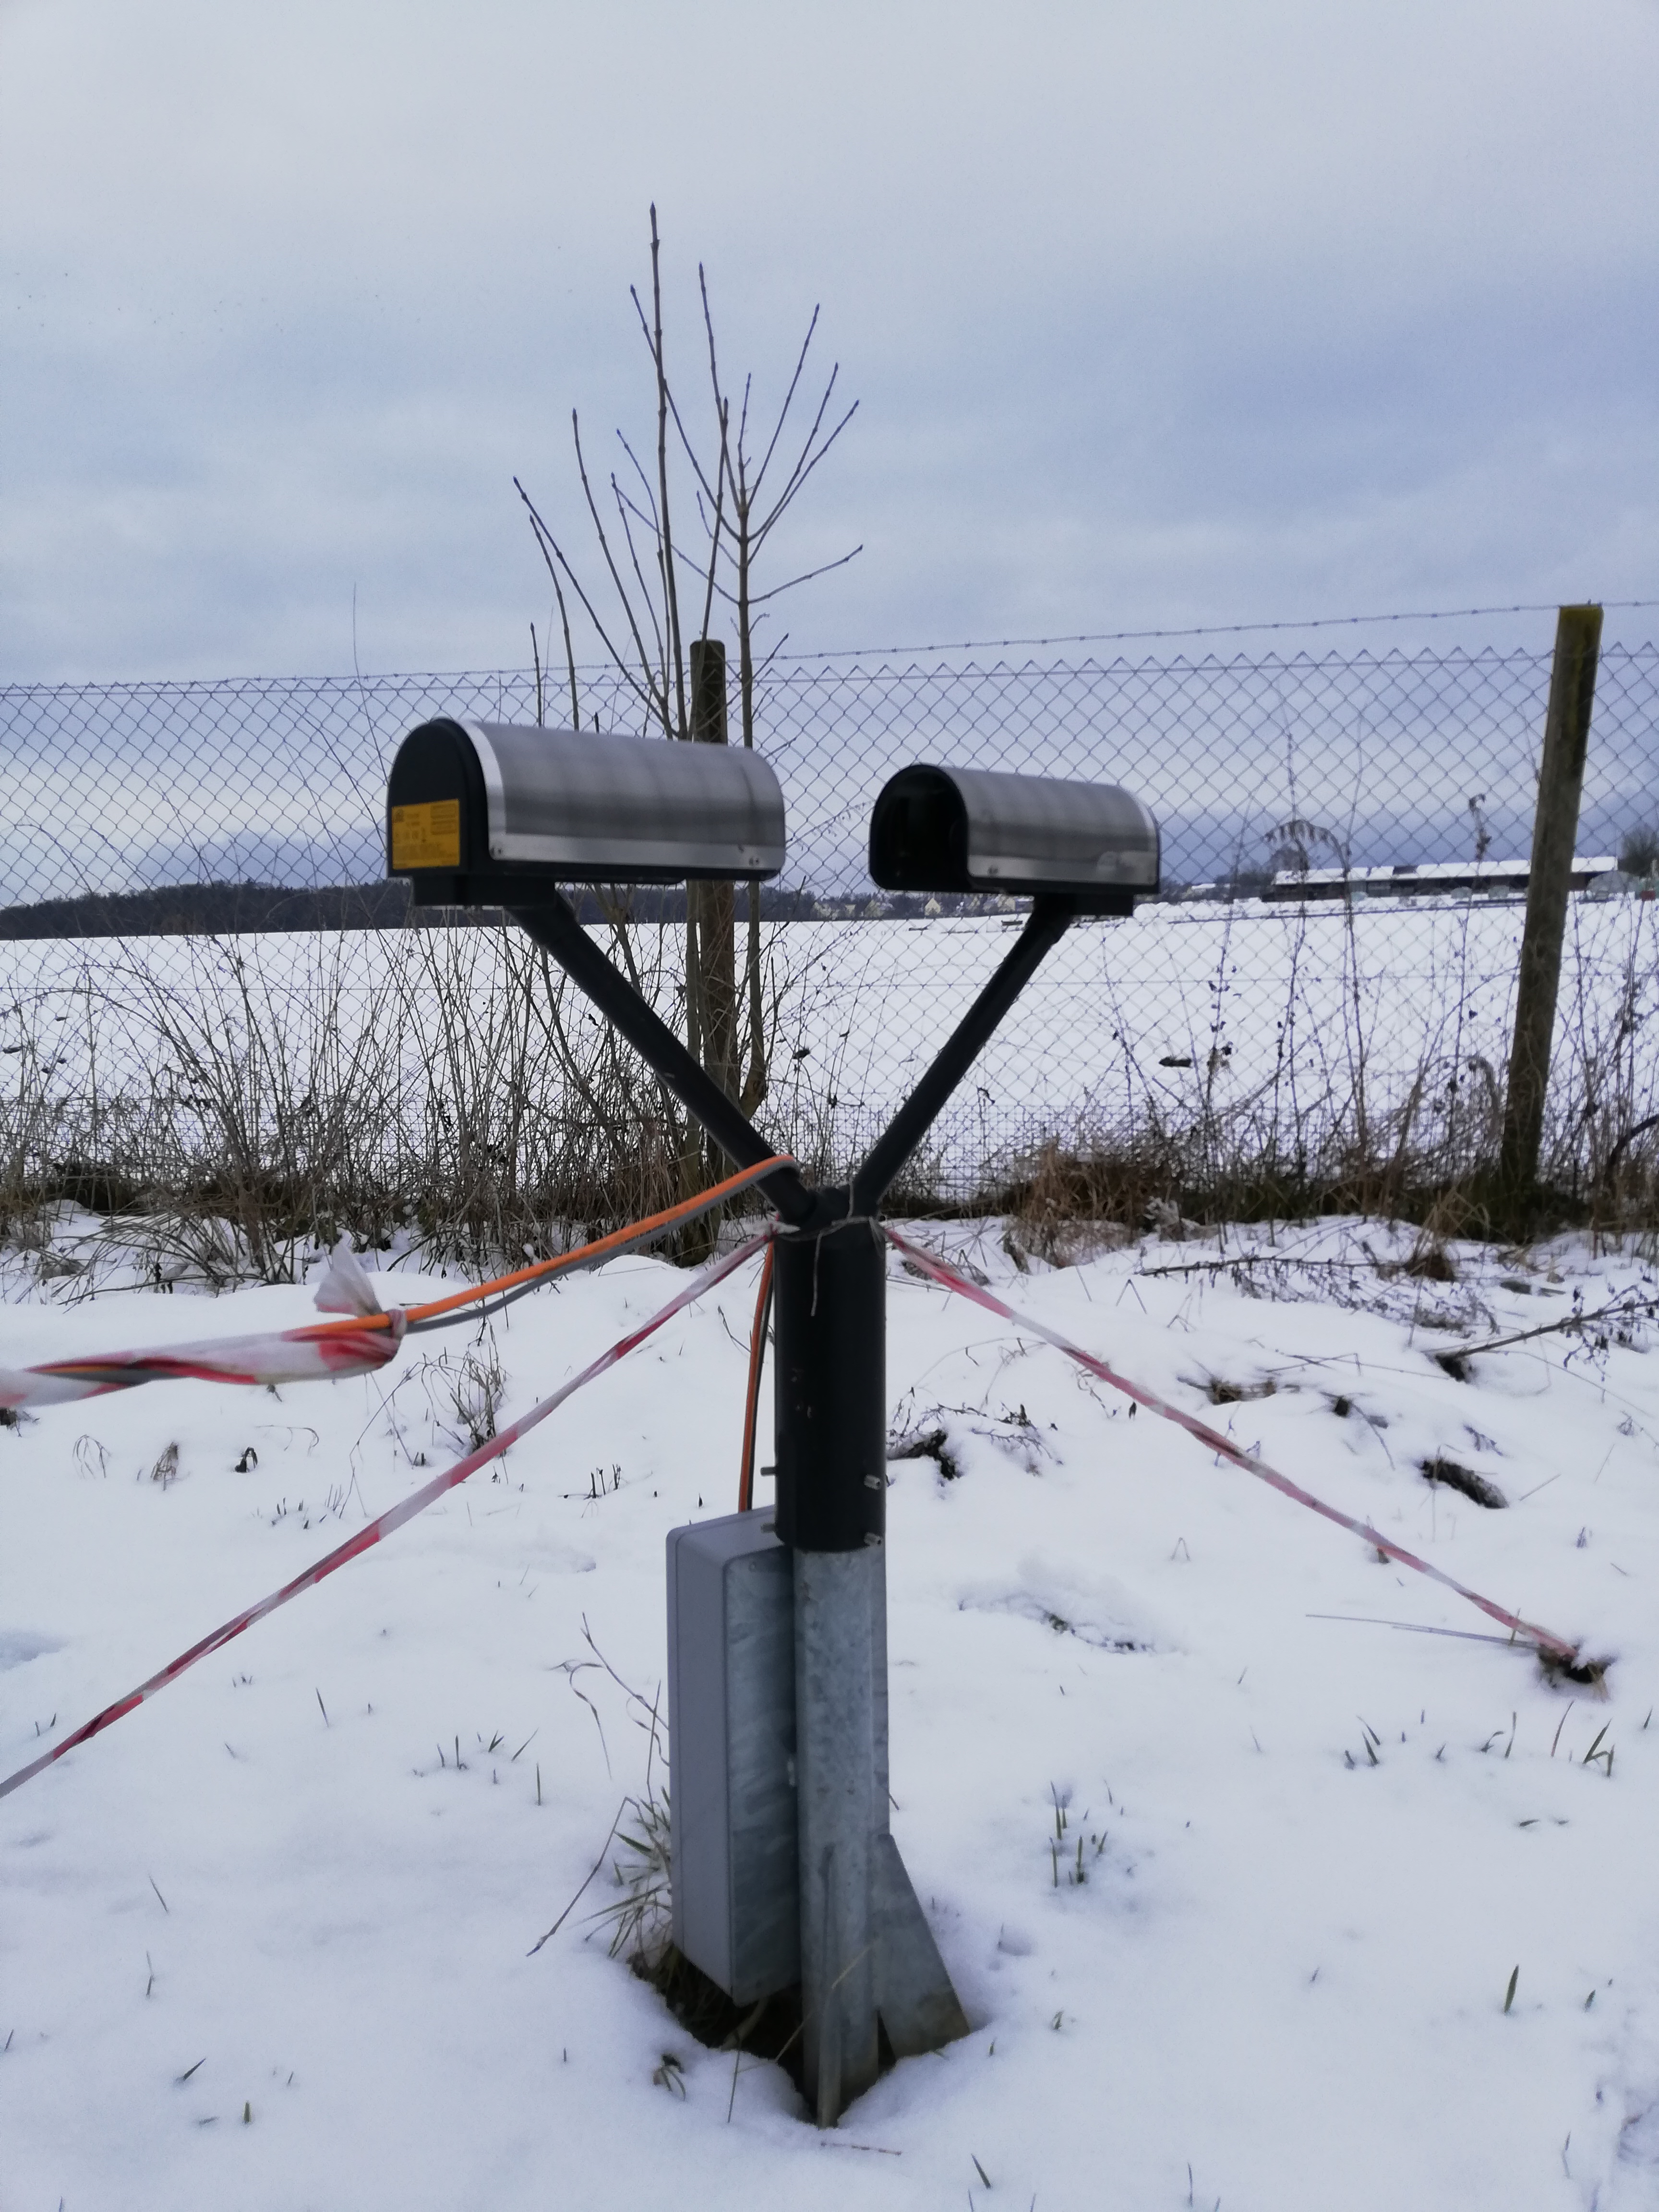
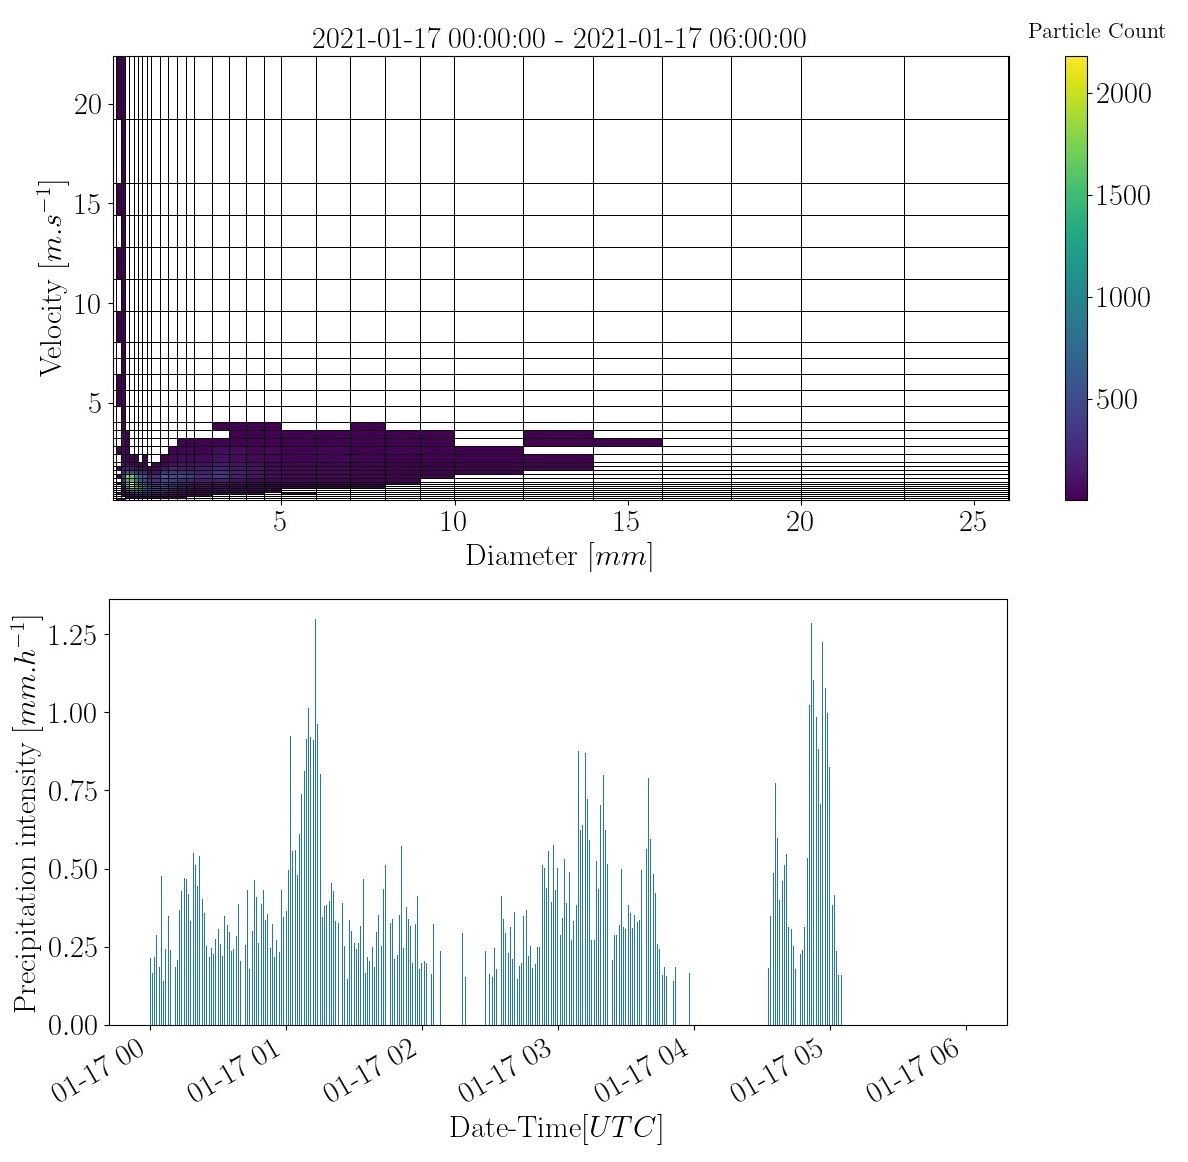
| A Parsivel Distrometer of Ott HydroMet is operated at the LAFO remote sensing site.
The data will be accessible via a download portal soon. Till then, data available on request. |
 |
| Variable | Temporal resolution | ||
|---|---|---|---|
| Particle size | 1 min | ||
| Particle fall velocity | 1 min | ||
| Rain rate | 1 min |

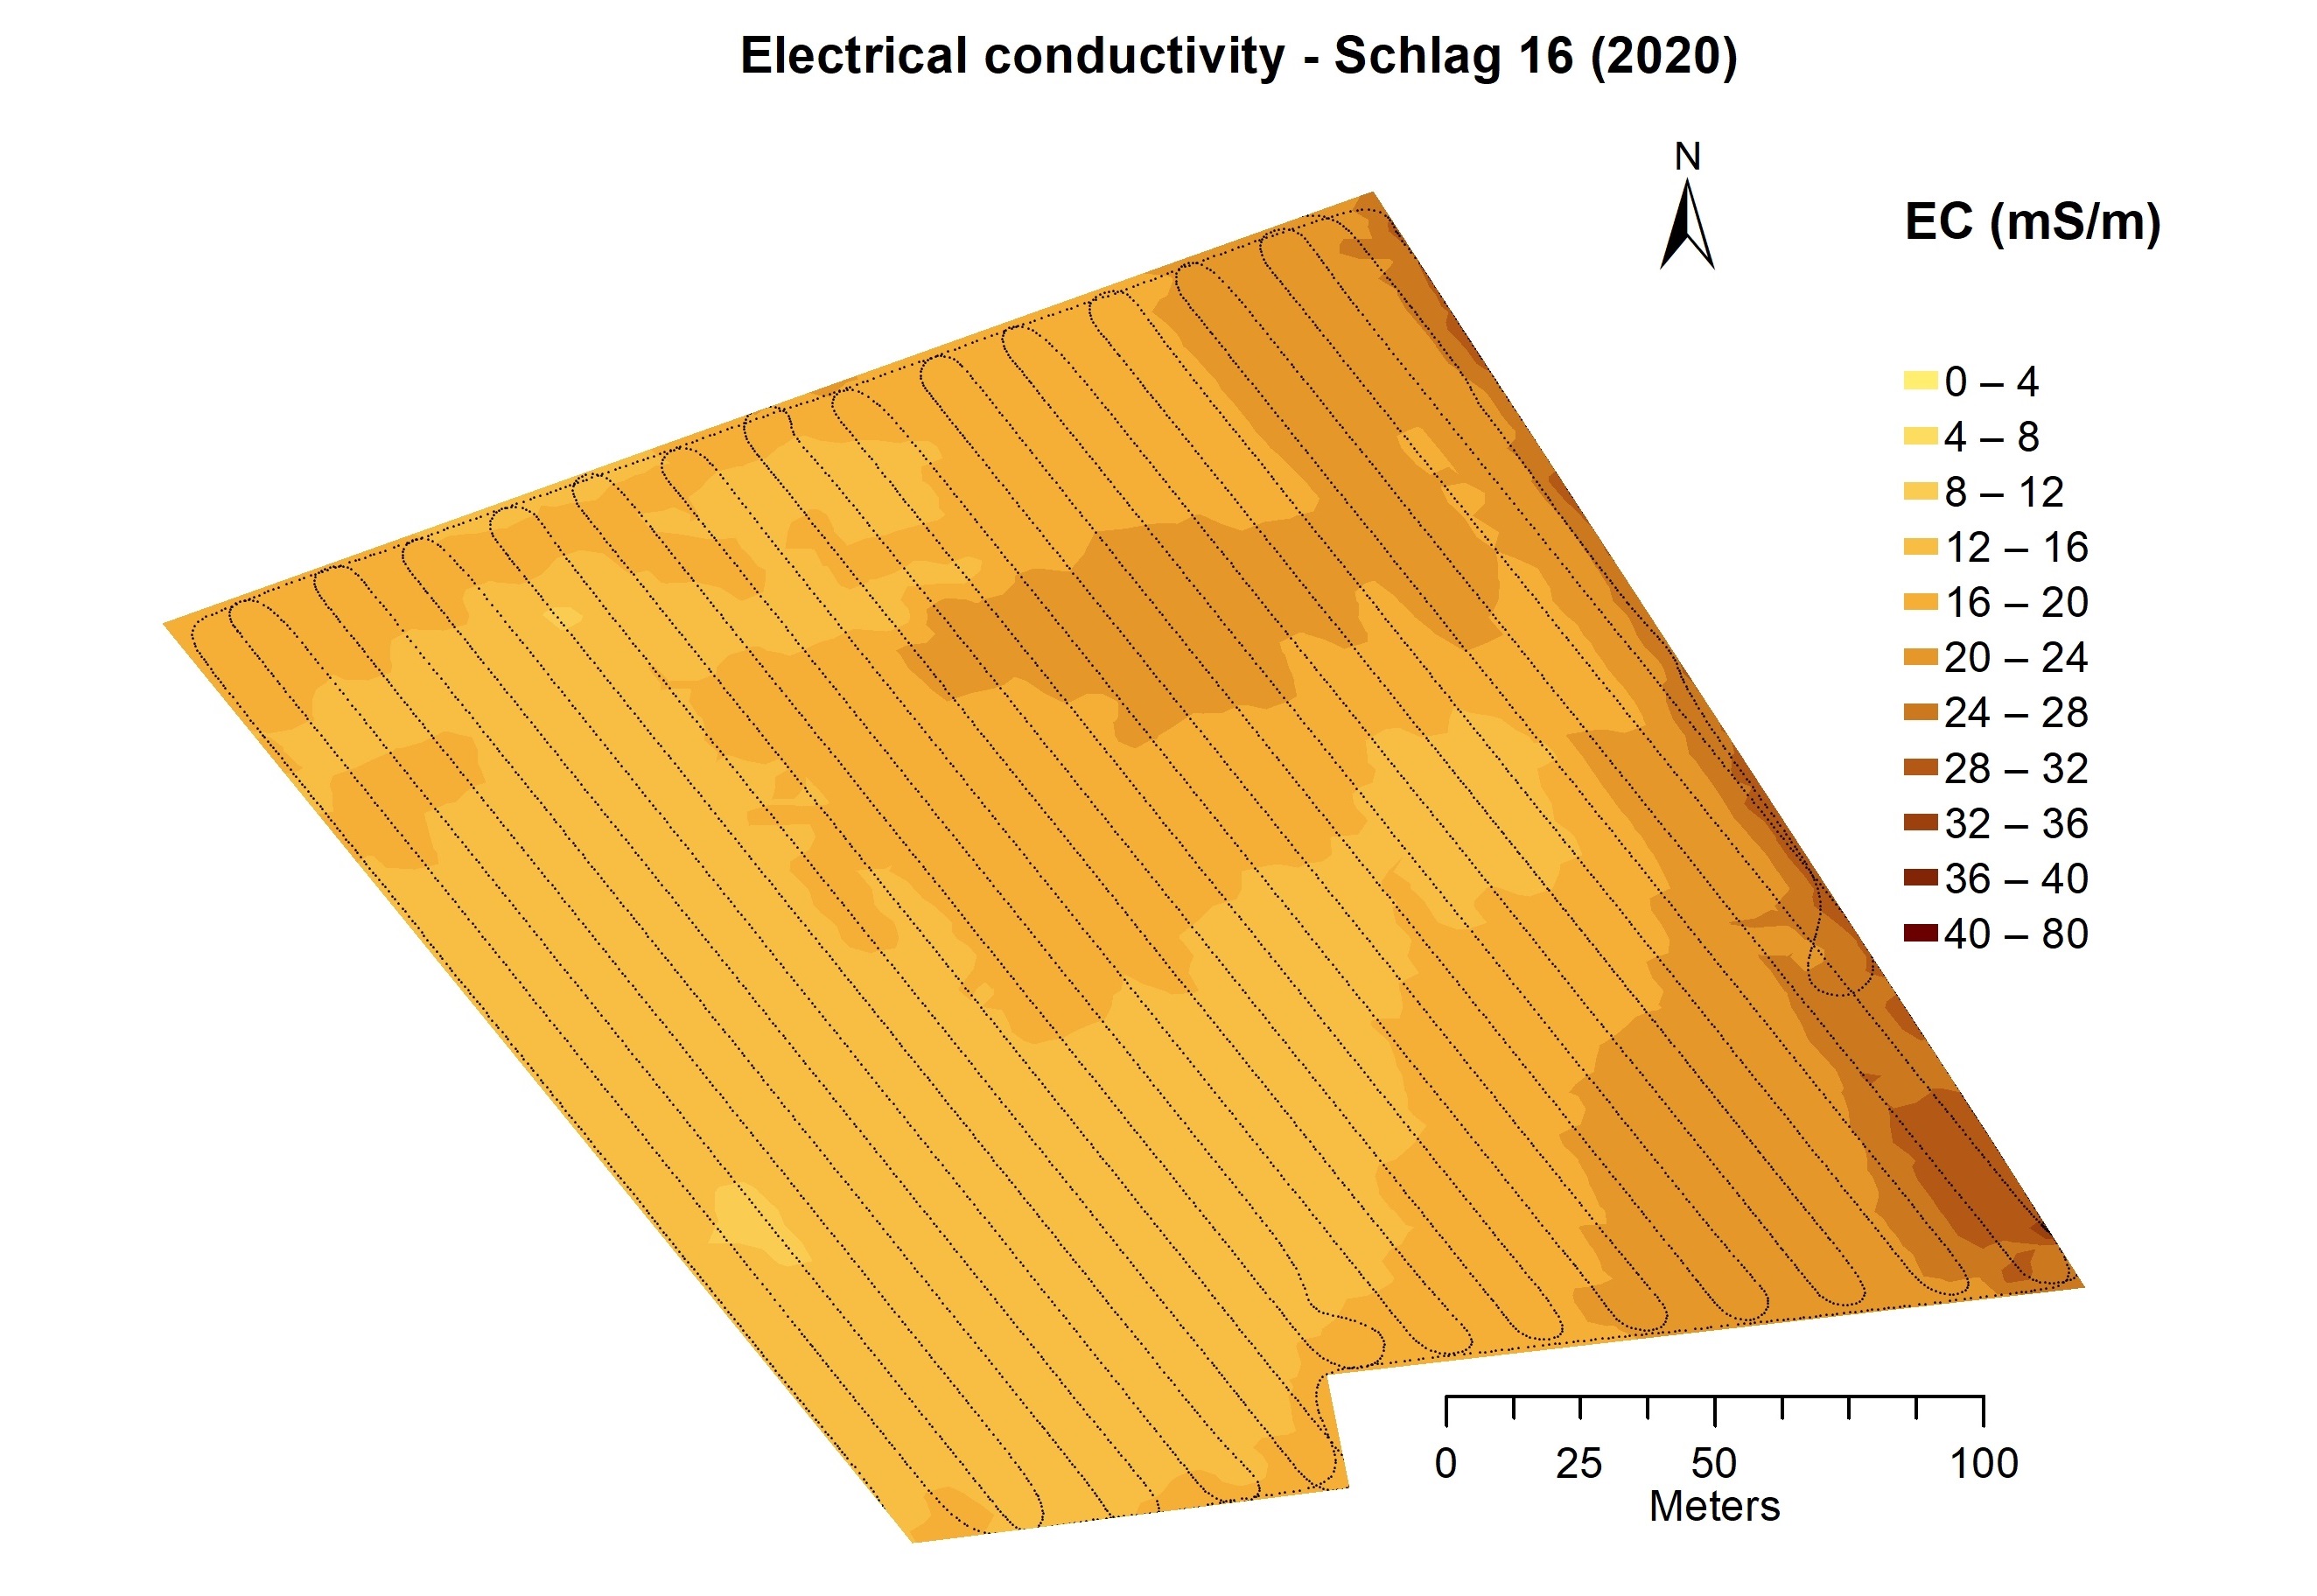
| EM38 | Schlag-1, Schlag-4, Schlag-8, Schlag-10, Schlag-12, Schlag-22 |
| ESRI shapefiles | Raster data | Field photos |
| Bulk Density | WaTSeN |
| Soil water content | WaTSeN |
| pF | WaTSeN |
| Crop Height | Schlag 1, Schlag 2, Schlag 3, Schlag 4, Schlag 5, Schlag 6, Schlag 7, Schlag 8, Schlag 9, Schlag 10, Schlag 11, Schlag 12, Schlag 13, Schlag 14, Schlag 15, Schlag 16, Schlag 17, Schlag 18, Schlag 19, Schlag 20, Schlag 21, Schlag 22, Schlag 23, Schlag 24, Schlag 25, Schlag 26, Schlag 27, Schlag 28, Schlag 29 |
| LAI | EC-S, EC-N |
| Phenology | Schlag 1, Schlag 2, Schlag 3, Schlag 4, Schlag 5, Schlag 6, Schlag 7, Schlag 8, Schlag 9, Schlag 10, Schlag 11, Schlag 12, Schlag 13, Schlag 14, Schlag 15, Schlag 16, Schlag 17, Schlag 18, Schlag 19, Schlag 20, Schlag 21, Schlag 22, Schlag 23, Schlag 24, Schlag 25, Schlag 26, Schlag 27, Schlag 28, Schlag 29 |
| Field practices | Schlag 1, Schlag 2, Schlag 3, Schlag 4, Schlag 5, Schlag 6, Schlag 7, Schlag 8, Schlag 9, Schlag 10, Schlag 11, Schlag 12, Schlag 13, Schlag 14, Schlag 15, Schlag 16, Schlag 17, Schlag 18, Schlag 19, Schlag 20, Schlag 21, Schlag 22, Schlag 23, Schlag 24, Schlag 25, Schlag 26, Schlag 27, Schlag 28, Schlag 29 |